
Show related data and explain why records matched
Turn a result list into an explainable working view
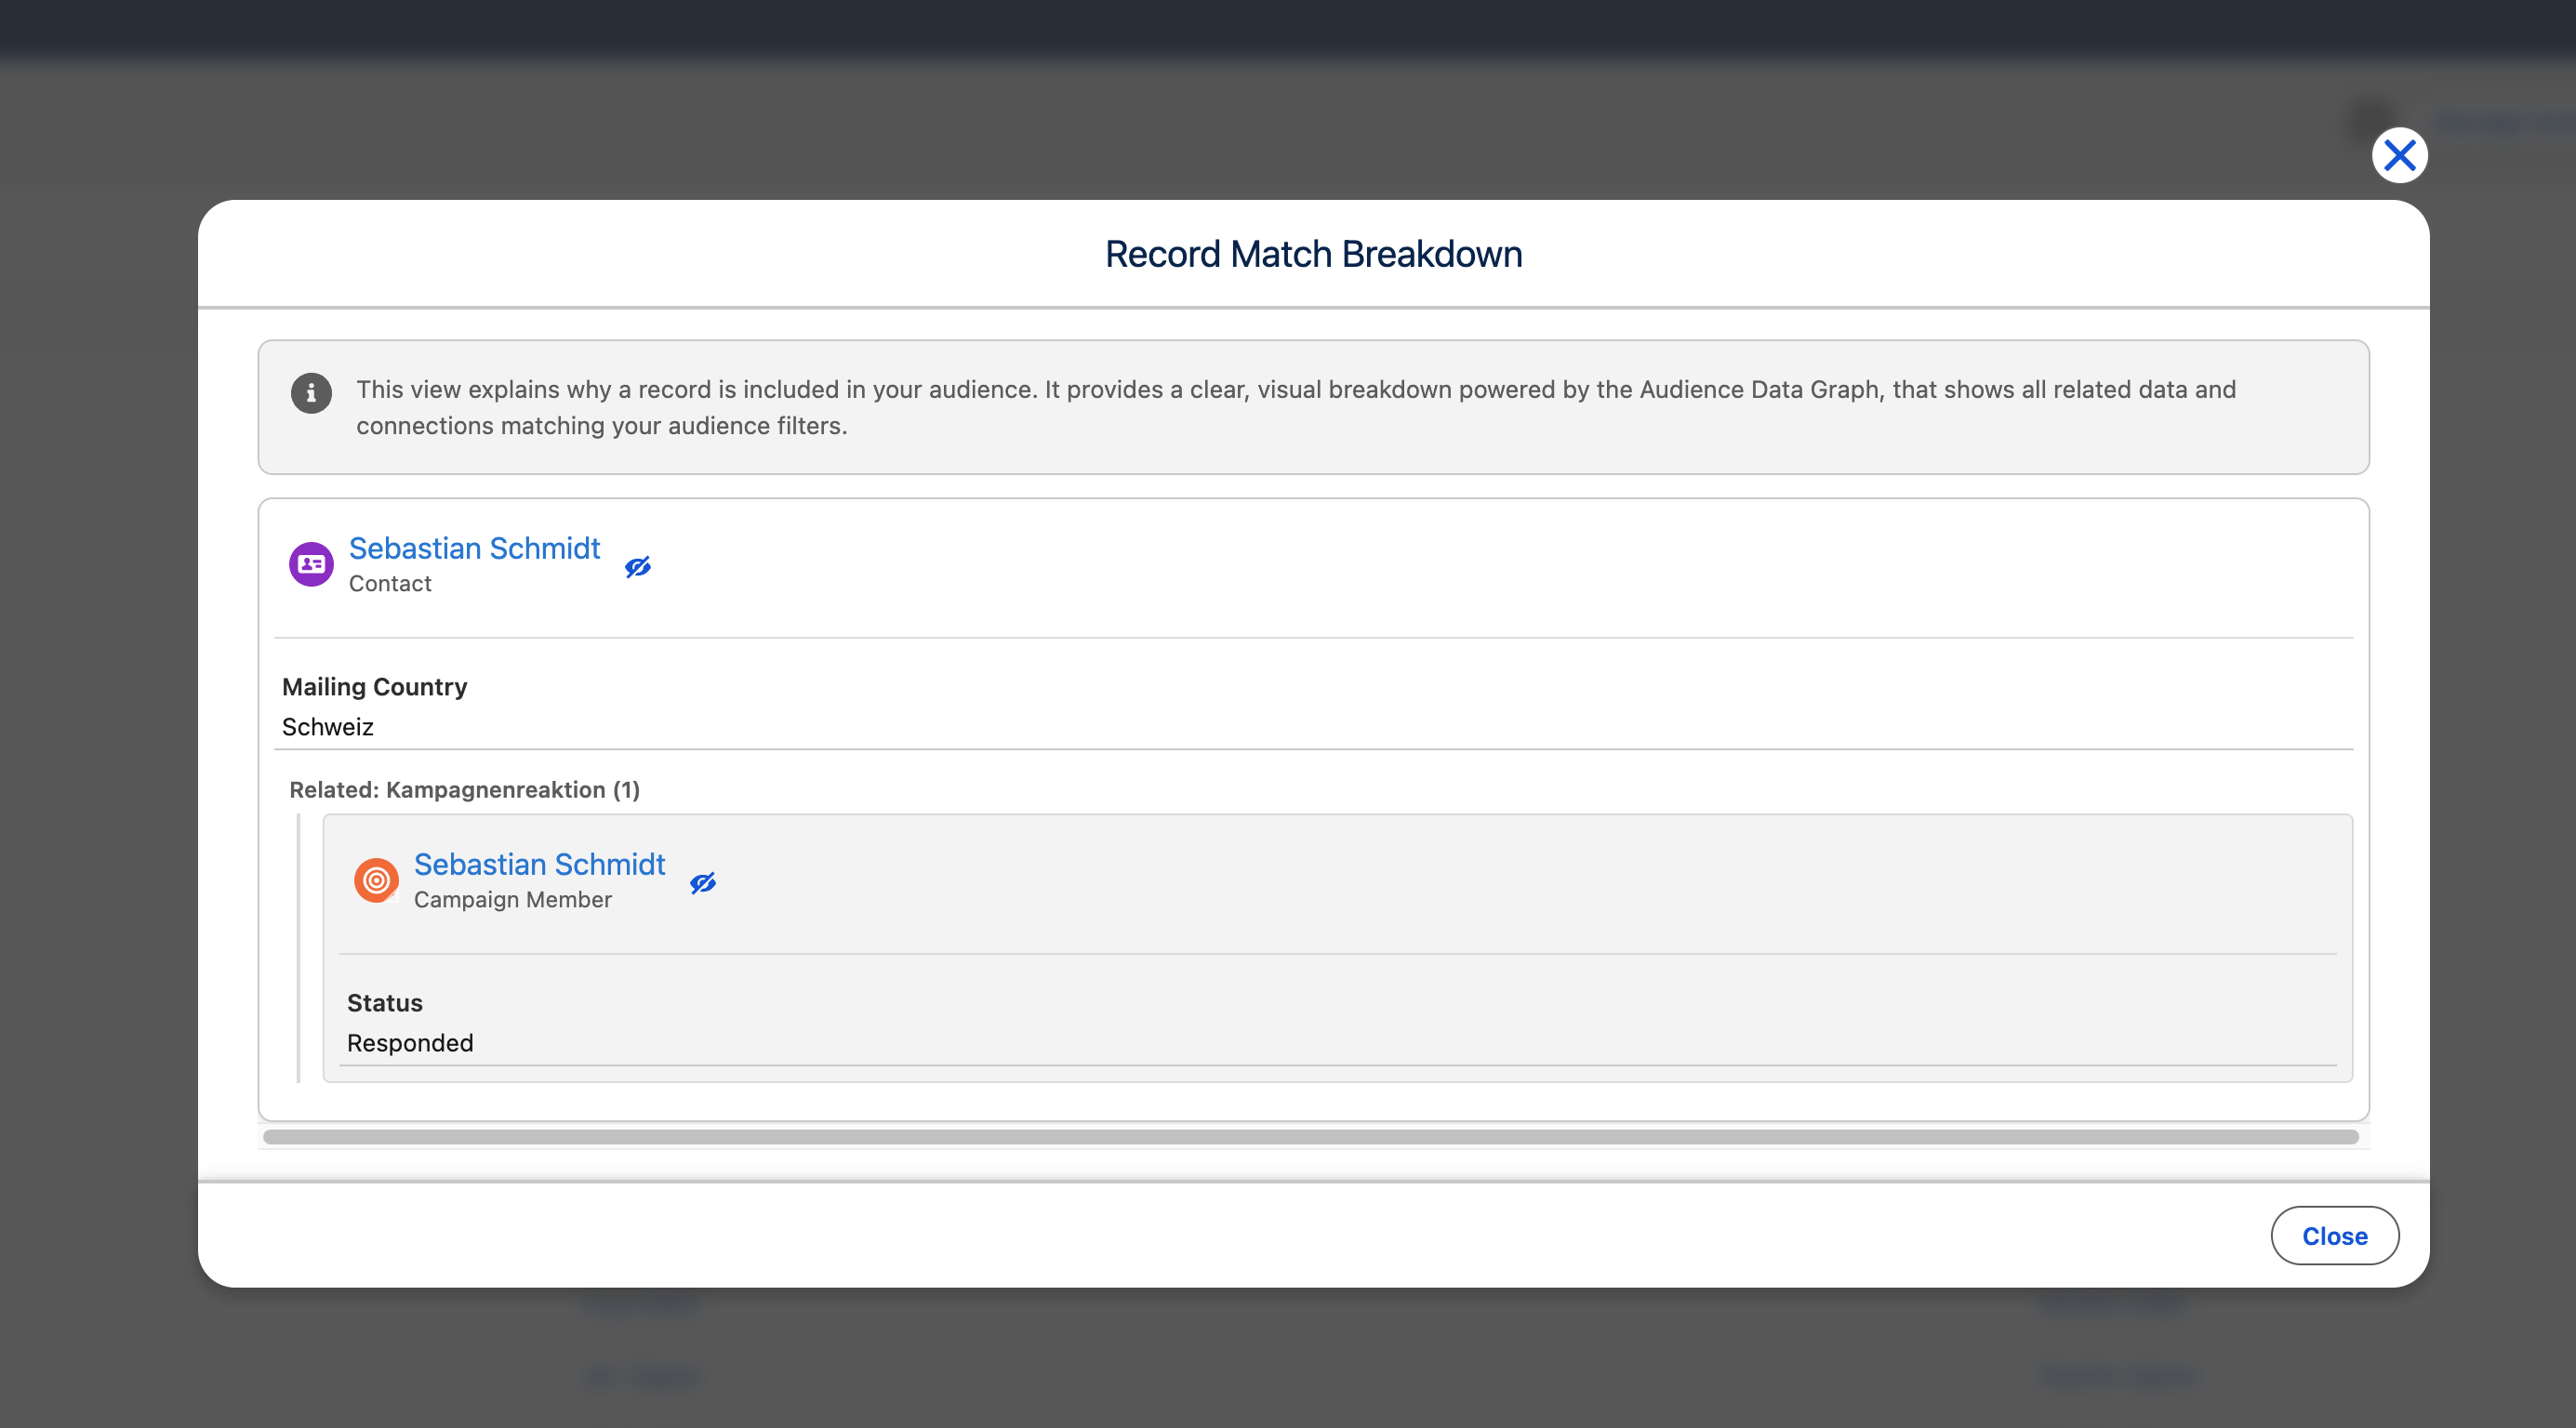
The results table can show ordinary record fields, parent fields, a chosen value from the audience’s related-record graph, and the current value of an aggregate the audience calculates. You can also open Record Match Breakdown for one result to see the records and conditions that made it qualify.
Choose result columns
Section titled “Choose result columns”- Run the audience and open its results.
- Open the table settings menu and select Select Fields to Display.
- Under Add Field, choose one of the available sources:
- Record Fields contains fields on the result record and parent fields up to five relationship levels deep.
- Preconfigured Data Graph Fields contains related values already configured for this audience.
- Audience Data Graph lets you configure a new related value from a path used by the audience, or include an aggregate the audience already calculates.
- Reorder or remove the selected columns, then select Save.
CAB remembers the selected columns for that initial object type in the current browser, so the same selection can appear in another audience that starts from that object. The preference is not stored on the audience and does not follow you to another browser. Name columns open the underlying Salesforce record.
Configure a Data Inclusion
Section titled “Configure a Data Inclusion”A Data Inclusion reduces a one-to-many relationship to one value per audience member. For example, you can show the amount from a contact’s highest-value opportunity without adding a second row for that contact.
- Choose a path under Audience Data Graph. The Configure Data Inclusion modal shows every object in the path.
- At each Step …: Find … from …, choose Sort By and Sort Order. CAB defaults to
CreatedDateand Descending. - At Final Step: Select Field from …, choose the Field to Include.
- Select Done, then save the column selection.
The sort at each hop decides which related record continues through the path. The last step decides which field value is displayed. CAB persists the Data Inclusion definition with the audience so it can be reused from Preconfigured Data Graph Fields. The separate choice to show that field as a result-table column remains browser-local, and selected inclusion columns are included in an export.
Data Inclusion columns are display and export values; they are not sortable in the results table.
Include an aggregate value
Section titled “Include an aggregate value”Every aggregate condition on the canvas, such as the sum of closed-won opportunity amounts per account, is also available as a value. Under Audience Data Graph, aggregates are listed with the function and field, for example SUM(Amount), with the calculation path as their description.
- Choose the aggregate under Audience Data Graph. The Configure Data Inclusion modal opens.
- If the path from the result record to the aggregated records crosses a one-to-many relationship, choose Sort By and Sort Order at each Step …: Find … from …. For example, when a contact’s account has several opportunities and the aggregate sums the products of one opportunity, the sort decides which opportunity supplies the value. When the path only follows lookups to parent records, the modal shows No selection needed instead.
- Review the summary. Calculation path shows each object on the path with its conditions; the objects inside Aggregate chain contribute all of their matching records, and the last one is marked Contributing records. Result type shows the type of the value, its currency, and its decimal places.
- Select Done, then save the column selection.
An aggregate value is calculated from the current records each time results are displayed or activated, using the same conditions as the aggregate on the canvas. Conditions on the result object itself only decide membership and are not part of the calculation. SUM, AVG, COUNT, and COUNT_DISTINCT produce numbers, SUM and AVG over a currency field produce an amount in the corporate currency, and MIN and MAX keep the type of their field, including dates.
When an aggregate cannot be calculated, for example because the aggregated records are no longer accessible, the column shows Aggregate value unavailable for the affected results instead of a zero or an empty value.
Explain one result
Section titled “Explain one result”Open the row action menu for a result and select Record Match Breakdown. CAB displays the matching record graph, including relevant parent and child records, their fields, and the conditions they satisfied. Use this to validate a sample of results before activation or to investigate an unexpected match.