

Measure extra conversions with a control group
Find out how many gifts or sales a campaign brings on top of what would have happened anyway
A conversion rate tells you how many people converted after you added them. It doesn’t tell you how many would have converted anyway: loyal donors give whether or not you mail them. A control group answers that. CAB keeps a random share of the people out of the campaign, measures them the same way, and compares the two groups. The difference is what the campaign brought: for example, about 73 more households who gave because of the Spring appeal 2026.
Use it to decide which campaigns are worth repeating, and to stop sending to audiences that would convert without you.
Control groups work on campaign adds, scheduled or run once. Data extension adds and final actions don’t keep a control group.
Before you start
Section titled “Before you start”What it costs. People in the control group don’t get the campaign. If the campaign works, you give up the extra conversions it would have brought them. The Extra conversions card on the outcome’s page shows how many: if the campaign brings about 5 extra conversions for every 100 people it reaches, you miss about 5 conversions for every 100 people you keep out.
How big to make it. A larger share gives a clearer answer sooner but keeps more people from the campaign. A smaller share costs less but needs more runs before the answer is clear. If you’re unsure, start with 10%, the share used in the examples on these pages. When you enter a share, CAB tells you how big the gap between the two groups must be for a clear answer, in extra conversions per 100 people reached. If the campaign brings less than that, the answer stays at No clear difference yet, even if the campaign works. If you expect a smaller gap, raise the share, or on a scheduled campaign add, keep the control group on for more runs.
What it needs. At least one outcome that counts something outside the campaign, such as a gift or a won opportunity. People in the control group are never added to the campaign, so they never get a campaign member record. An outcome that checks the campaign member record, such as Responded to the campaign, can’t measure them.
Keep a control group on a scheduled campaign add
Section titled “Keep a control group on a scheduled campaign add”- Open the audience, select Manage Schedule, and open the campaign’s settings under Configure Actions.
- Open Measure results and pick at least one outcome under Outcomes to measure that counts something outside the campaign, such as a gift or a won opportunity (Gift received in the example below).
- Enter a share in Control group (%). CAB shows how many people that is, for example Up to 101 of 1,016 people go to the control group. Once it knows how many new people the audience usually brings per run, it shows that instead, for example ~10 of about 100 new people per run in the control group.
- Read the estimate below it. Once the audience has run before, CAB says how many of its people usually convert and how big the gap must be for a clear answer, for example This audience converts at about 7.6% by day 30. and For a clear answer, the first update needs a gap of about 5.6 more conversions per 100 people reached. After three runs, about 3.2 is enough. Until CAB knows how many new people the audience brings per run, it gives one figure for a single run instead: A clear answer needs a gap of about 5.6 more conversions per 100 people reached. When the audience has no results for the outcome yet, the rate comes from all audiences, for example Across all audiences, this outcome converts at about 7.6% by day 30. With no rate at all, CAB only says when the first update arrives.
- Select Done and save the schedule.
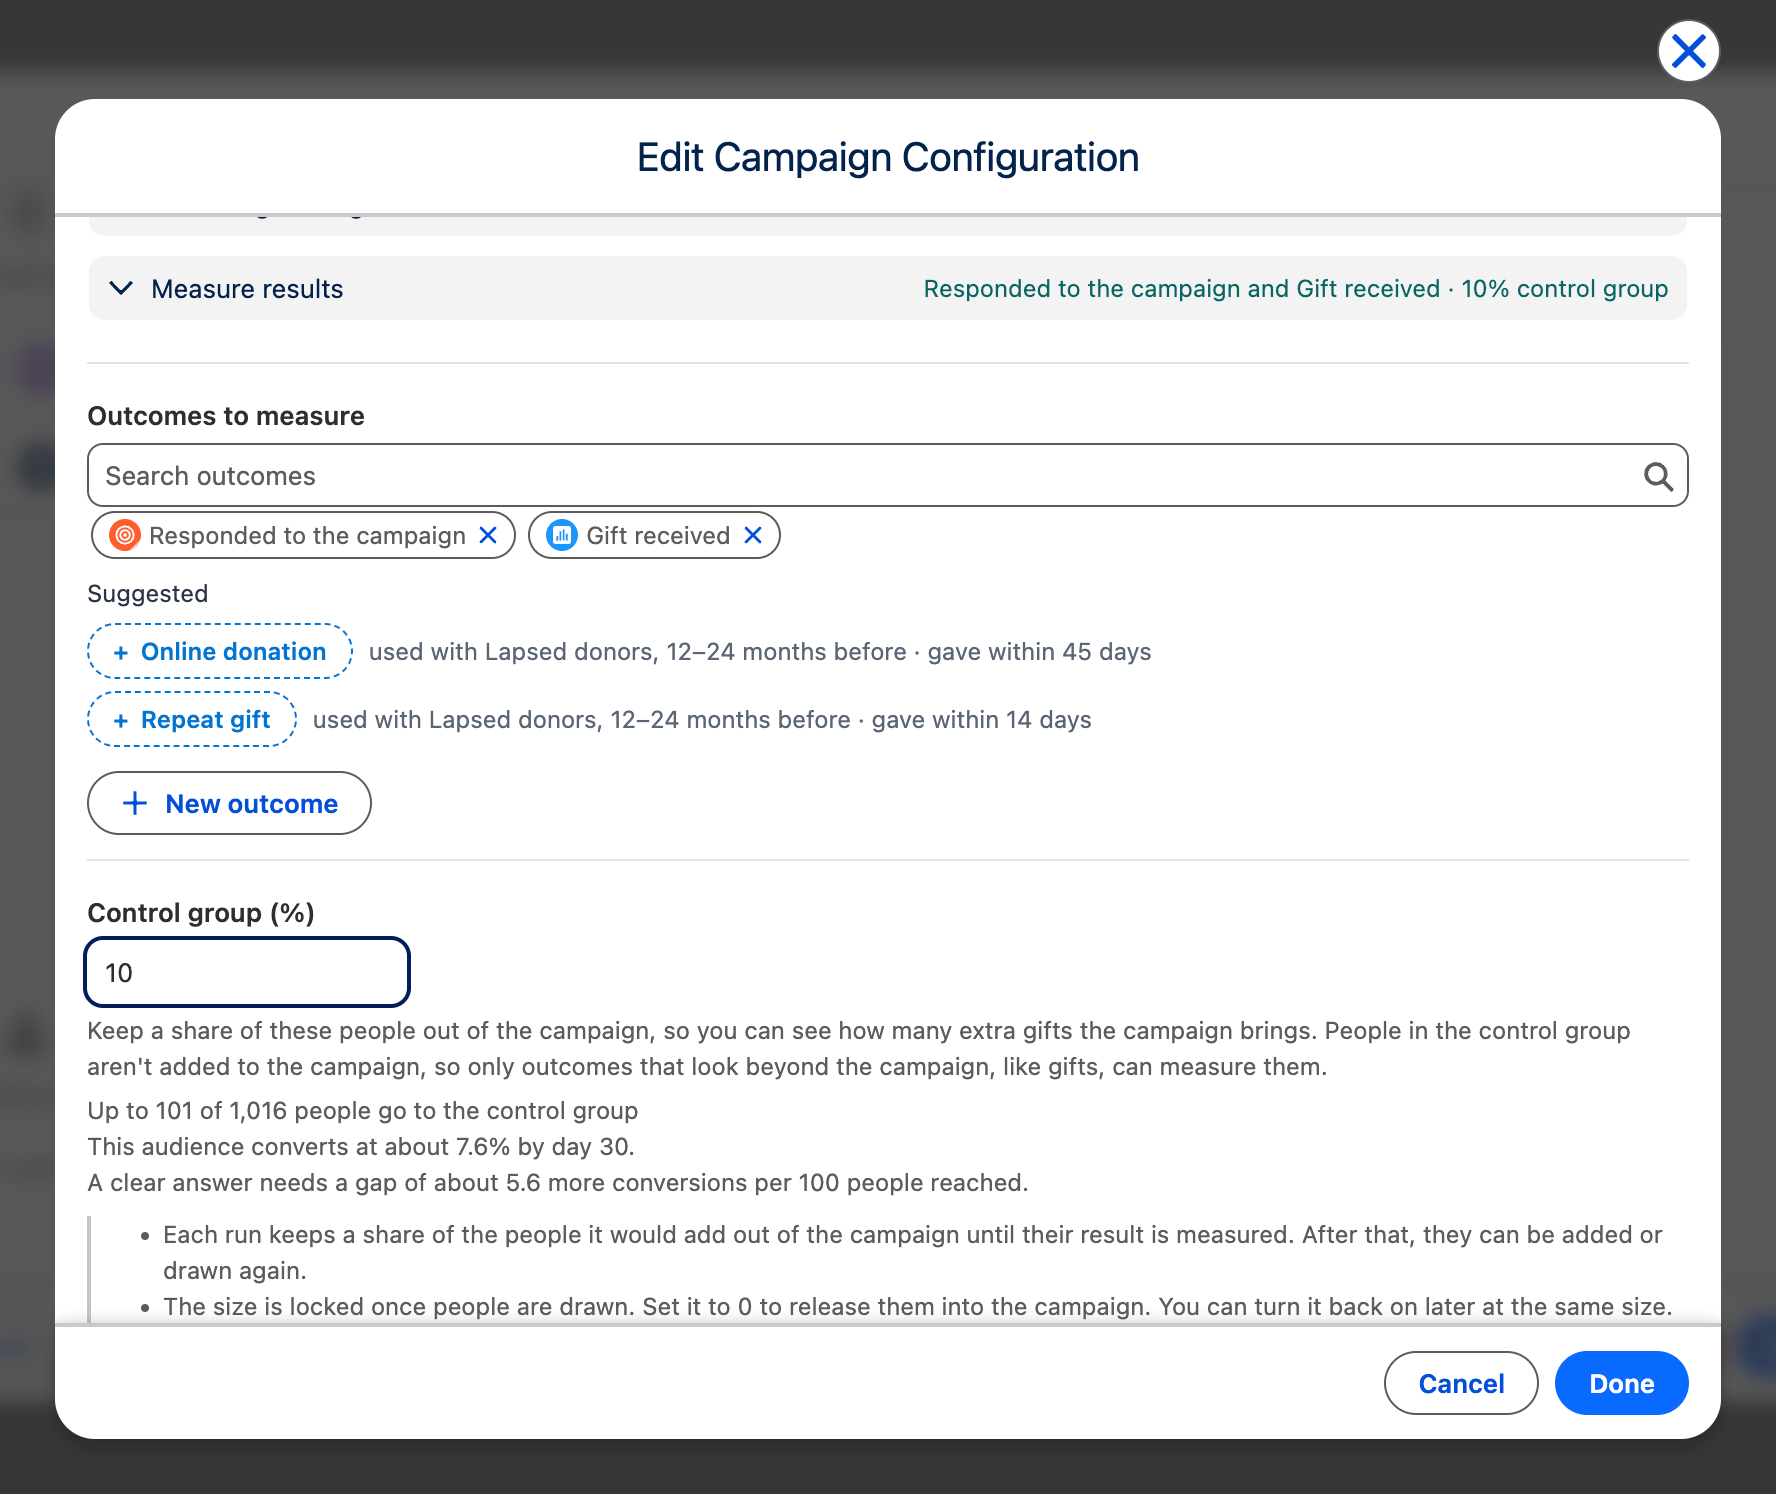
In this example, Responded to the campaign is measured for the people added only. Gift received is compared with the control group.
How people are drawn on every run
Section titled “How people are drawn on every run”- Each run draws its control group at random from the people it would newly add. Only people who aren’t campaign members yet can be in it.
- A person stays in the control group until their result for the outcome is final, after the last check: for a 30-day window, until day 60. After that, a later run can add them to the campaign or draw them again.
- The comparison adds up every run, so the answer gets clearer with every run.
A control group isn’t a permanent “never contact” list. To keep certain people out of a campaign for good, leave them out of the audience instead.
The share stays the same
Section titled “The share stays the same”Once the control group has drawn people, you can’t change its share, so every run is compared on the same terms. To stop the comparison, release the control group (see Release the control group). If you turn it back on later, it uses the same share as before.
One control group per campaign
Section titled “One control group per campaign”A control group needs its scheduled campaign add to be the only scheduled campaign add on that campaign. If another scheduled campaign add targets the same campaign, remove it before you turn on the control group.
When you add people to that campaign in any other way, for example with Add to Campaign, CAB leaves out the people in the campaign’s control group until their result is final. When you pick the campaign, Add to Campaign says so:
This campaign already has a control group. While it is being measured, the people in it are left out of this add.In a split, each campaign card keeps its own control group. See Split a schedule’s new members between campaigns.
Campaign adds set to “Changes only”
Section titled “Campaign adds set to “Changes only””A campaign add set to Changes only sends only people who joined the audience since the last run. When someone’s time in the control group is over, they are no longer new to the audience, so such a run would never send them. CAB therefore adds them to the campaign for you after each such run, as long as they are still in the audience, without measuring them. A campaign add that sends the whole audience on every run needs none of this: each run draws its control group afresh.
When a schedule ends or you remove a campaign add
Section titled “When a schedule ends or you remove a campaign add”A schedule ends on its end date or when you select Unschedule. A campaign add stops when you remove it from a schedule, in the schedule editor or through Cabby. Either way, no control group is drawn for it from then on, and the campaign is free for a new campaign add with its own. The results and the comparison already measured stay on the outcome’s page, and the runs stay in run history.
If you add the same campaign again later, that is a new campaign add. The outcome’s Actions tab lists its results next to the old ones, both count toward that campaign, and each is compared with its own control group. People still in an earlier control group for that campaign stay out of it until their result is final. After that, a later run can add them or draw them again. A campaign add set to Changes only sends the whole audience on its next run, so these people are offered again.
Release the control group
Section titled “Release the control group”Release the control group when you have the answer you need and want everyone to get the campaign:
- In the schedule’s campaign list, open the campaign’s menu and select Release control group.
- Confirm Release control group?. It shows how many people are in the control group now.
- Save the schedule.
From the next run on, nobody is kept out: people in the control group who are still in the audience are added to the campaign, and extra conversions are no longer measured. You can turn the control group back on later at the same share; it then draws new people.
Keep a control group on a campaign add you run once
Section titled “Keep a control group on a campaign add you run once”Add to Campaign also offers Control group (%) under Measure results, once you pick an outcome that counts something outside the campaign. CAB shows how many people it keeps out, for example Up to 25 of 250 people go to the control group. Below it, the same estimate as on a scheduled campaign add says how many people usually convert and how big the gap must be for a clear answer, for this single add. Later campaign adds to the same campaign, scheduled or run once, leave these people out until their result is final. After that, a later add can include them.
Its comparison shows in the audience’s run history, on that campaign add. It also counts in the outcome’s comparison, as one run, just like a run of a scheduled campaign add.
To see or use the people later, open the audience’s run history and expand the campaign add:
- View / export control group lists the people kept out and lets you export them.
- Add control group to campaign adds them with the status and field mappings the add used. Under Who to add, choose only those still in the audience at its latest run, or the whole control group. This can’t be undone. Wait until their result is final. If you add them earlier, the campaign reaches the control group too, and the comparison shows less effect than there really was. People who also belong to another of the campaign’s control groups are left out while that group is still being measured.
Read the answer
Section titled “Read the answer”With a control group, the outcome’s page answers how much the campaign brought. The Extra conversions card under Results gives one of three answers, and a short version appears under the rate at the top of the page. Both cover the time frame you pick in the Compare bar (all time by default); see Choose a time frame.
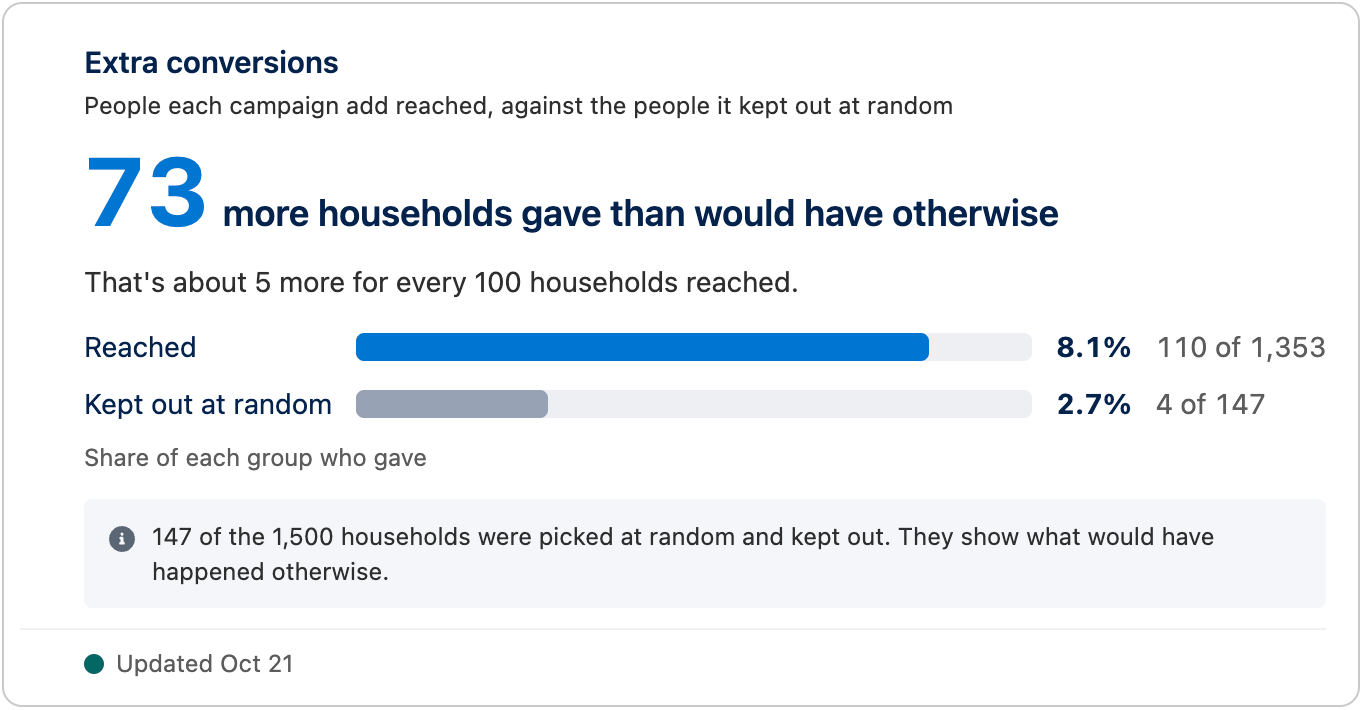
“73 more …”: the campaign brought extra conversions, for example:
73 more households gave than would have otherwiseBelow it: That’s about 5 more for every 100 households reached.
In the example, 110 of the 1,353 households the campaign reached gave (8.1%), and 4 of the 147 households kept out gave (2.7%). Without the campaign, about 2.7% of the households reached would have given as well: about 37 of the 1,353. 110 minus 37 leaves about 73 households who gave because of the campaign, about 5 for every 100 households reached.
No clear difference yet. The households reached gave a bit more often, or a bit less often, than the households kept out, but the gap is so small it could be chance. The card says why, for example With only 147 households kept out, a gap this small could be chance. Leave the control group switched on for the next runs before you decide: the answer gets clearer with every run.
“30 fewer …”: for example 30 fewer households gave than would have otherwise. The households kept out gave more often than the households reached. Don’t act on one or two runs: early results move a lot. If the answer stays the same over several runs, the campaign isn’t helping this audience; consider changing the message or leaving the audience out.
Why 8.1% and not the overall rate of 10.4%? The answer only uses runs that kept a control group, here the Spring appeal 2026’s 8 runs between Feb 18 and May 27. The overall rate covers every action that measures the outcome, including campaigns without a control group. So compare 8.1% with 2.7%, not 10.4%.
The Extra conversions card
Section titled “The Extra conversions card”Under the answer, two bars show the share of each group who gave: Reached (the people the campaign added) and Kept out at random (the control group), each with its count, for example 110 of 1,353.
A note at the bottom says who was kept out: 147 of the 1,500 households were picked at random and kept out. They show what would have happened otherwise. Each run is compared with its own control group. When some runs kept nobody out, for example runs from before you turned on the control group, the note says which runs the answer comes from: From the 8 runs that kept a control group. The other 2 runs kept nobody out, so they aren’t part of this. A run whose campaign add no longer exists, for example because its audience was deleted, can’t be compared, and the note says how many such runs there are: 2 runs could not be compared.
At the top of the page, a second line below the short answer says which runs are compared, for example Compares 8 runs that had a control group, Feb 18 to May 27.
Compare audiences and campaigns
Section titled “Compare audiences and campaigns”When you compare audiences or campaigns, the card shows one row for each, measured against its own control group:
- “… more” or “… fewer” for every 100 people reached, such as 5 more per 100 households reached, with the total below it: About 73 more households in total.
- No clear difference yet, with the reason.
- Not measured, when it kept nobody out: Nobody was kept out, so there is nothing to compare with. The row says how to change that, for example To measure it, set up a control group when adding it to a campaign.
Beside each row, small bars show the share of each group who gave. All rows use the same bar length for the same share, so you can compare them at a glance. A row that kept nobody out shows only its Reached bar, with the word nobody under Kept out at random. When only some of a row’s runs kept a control group, it says so, for example From 1 of its 2 runs; the other kept nobody out. The last row, Overall outcome, gives the same kind of answer for everyone together.
Extra conversions counts people, not money. To see amounts such as the total given, add a metric; it shows amounts for everyone added and doesn’t compare them with the control group (see Add your own metrics).