

Read your results
See how each outcome is doing, which audiences and campaigns lead to it, and what the conversions are worth
CAB checks every night and updates each group of people on set days after they were added, such as day 7, 14 and 30. The examples on this page follow one outcome, “Gift received”: a household counts as converted when it gives within 30 days of being added. It is measured on campaigns such as the Year-end appeal 2025, the Spring appeal 2026 and the Autumn letter appeal 2026, fed by audiences such as “Mid-level donors” and “Lapsed donors, 12–24 months”. For the words used here, see Words used on these pages.
See all outcomes at a glance
Section titled “See all outcomes at a glance”The CAB Outcomes tab lists every outcome. The folder list on the left starts with All outcomes, followed by each folder and how many outcomes it holds. Type in Find folder… to narrow the list, and select a folder to see only its outcomes.
With the Manage outcomes permission, you can create and change folders. To create a folder, select New folder at the end of the list. To rename or delete the selected folder, use Rename… or Delete folder… in its menu. Deleting a folder doesn’t delete its outcomes or their results. You find them under All outcomes.
Above the table, select With results, No results yet (waiting for their first results) or Not in use (no action measures them yet) to show only those outcomes, or All to show every outcome.
Type in Search outcomes… to search the outcome names in the folder you selected. In All outcomes, the search also finds folder names. While you search there, a Folder column takes the place of Last changed and shows where each outcome is; you can’t sort by it. Select a name in that column to open the folder.
Select a column heading to sort by Outcome (the name), Last changed or Rate, and select it again to reverse the order. The tab opens sorted by Rate, highest first. Last changed is the date of the latest change to the outcome: its name, description, folder or settings, its rule, or its metrics.
With All selected, outcomes with results come first. Each row shows:
- the rate on the right, for example 10.4% gave within 30 days. The wording follows the goal: “gave” for a gift, “converted” for a custom outcome;
- the counts behind it: 1,515 of 14,621 newly added households gave · 57 more from actions still counting. The rate only uses people whose window (the 30 days after being added) is over; the 57 are more recently added households that have already given, but whose window is still open. See How results keep updating;
- when the next update is due.
How many extra conversions a campaign brought is on the outcome’s page; see Read the answer.
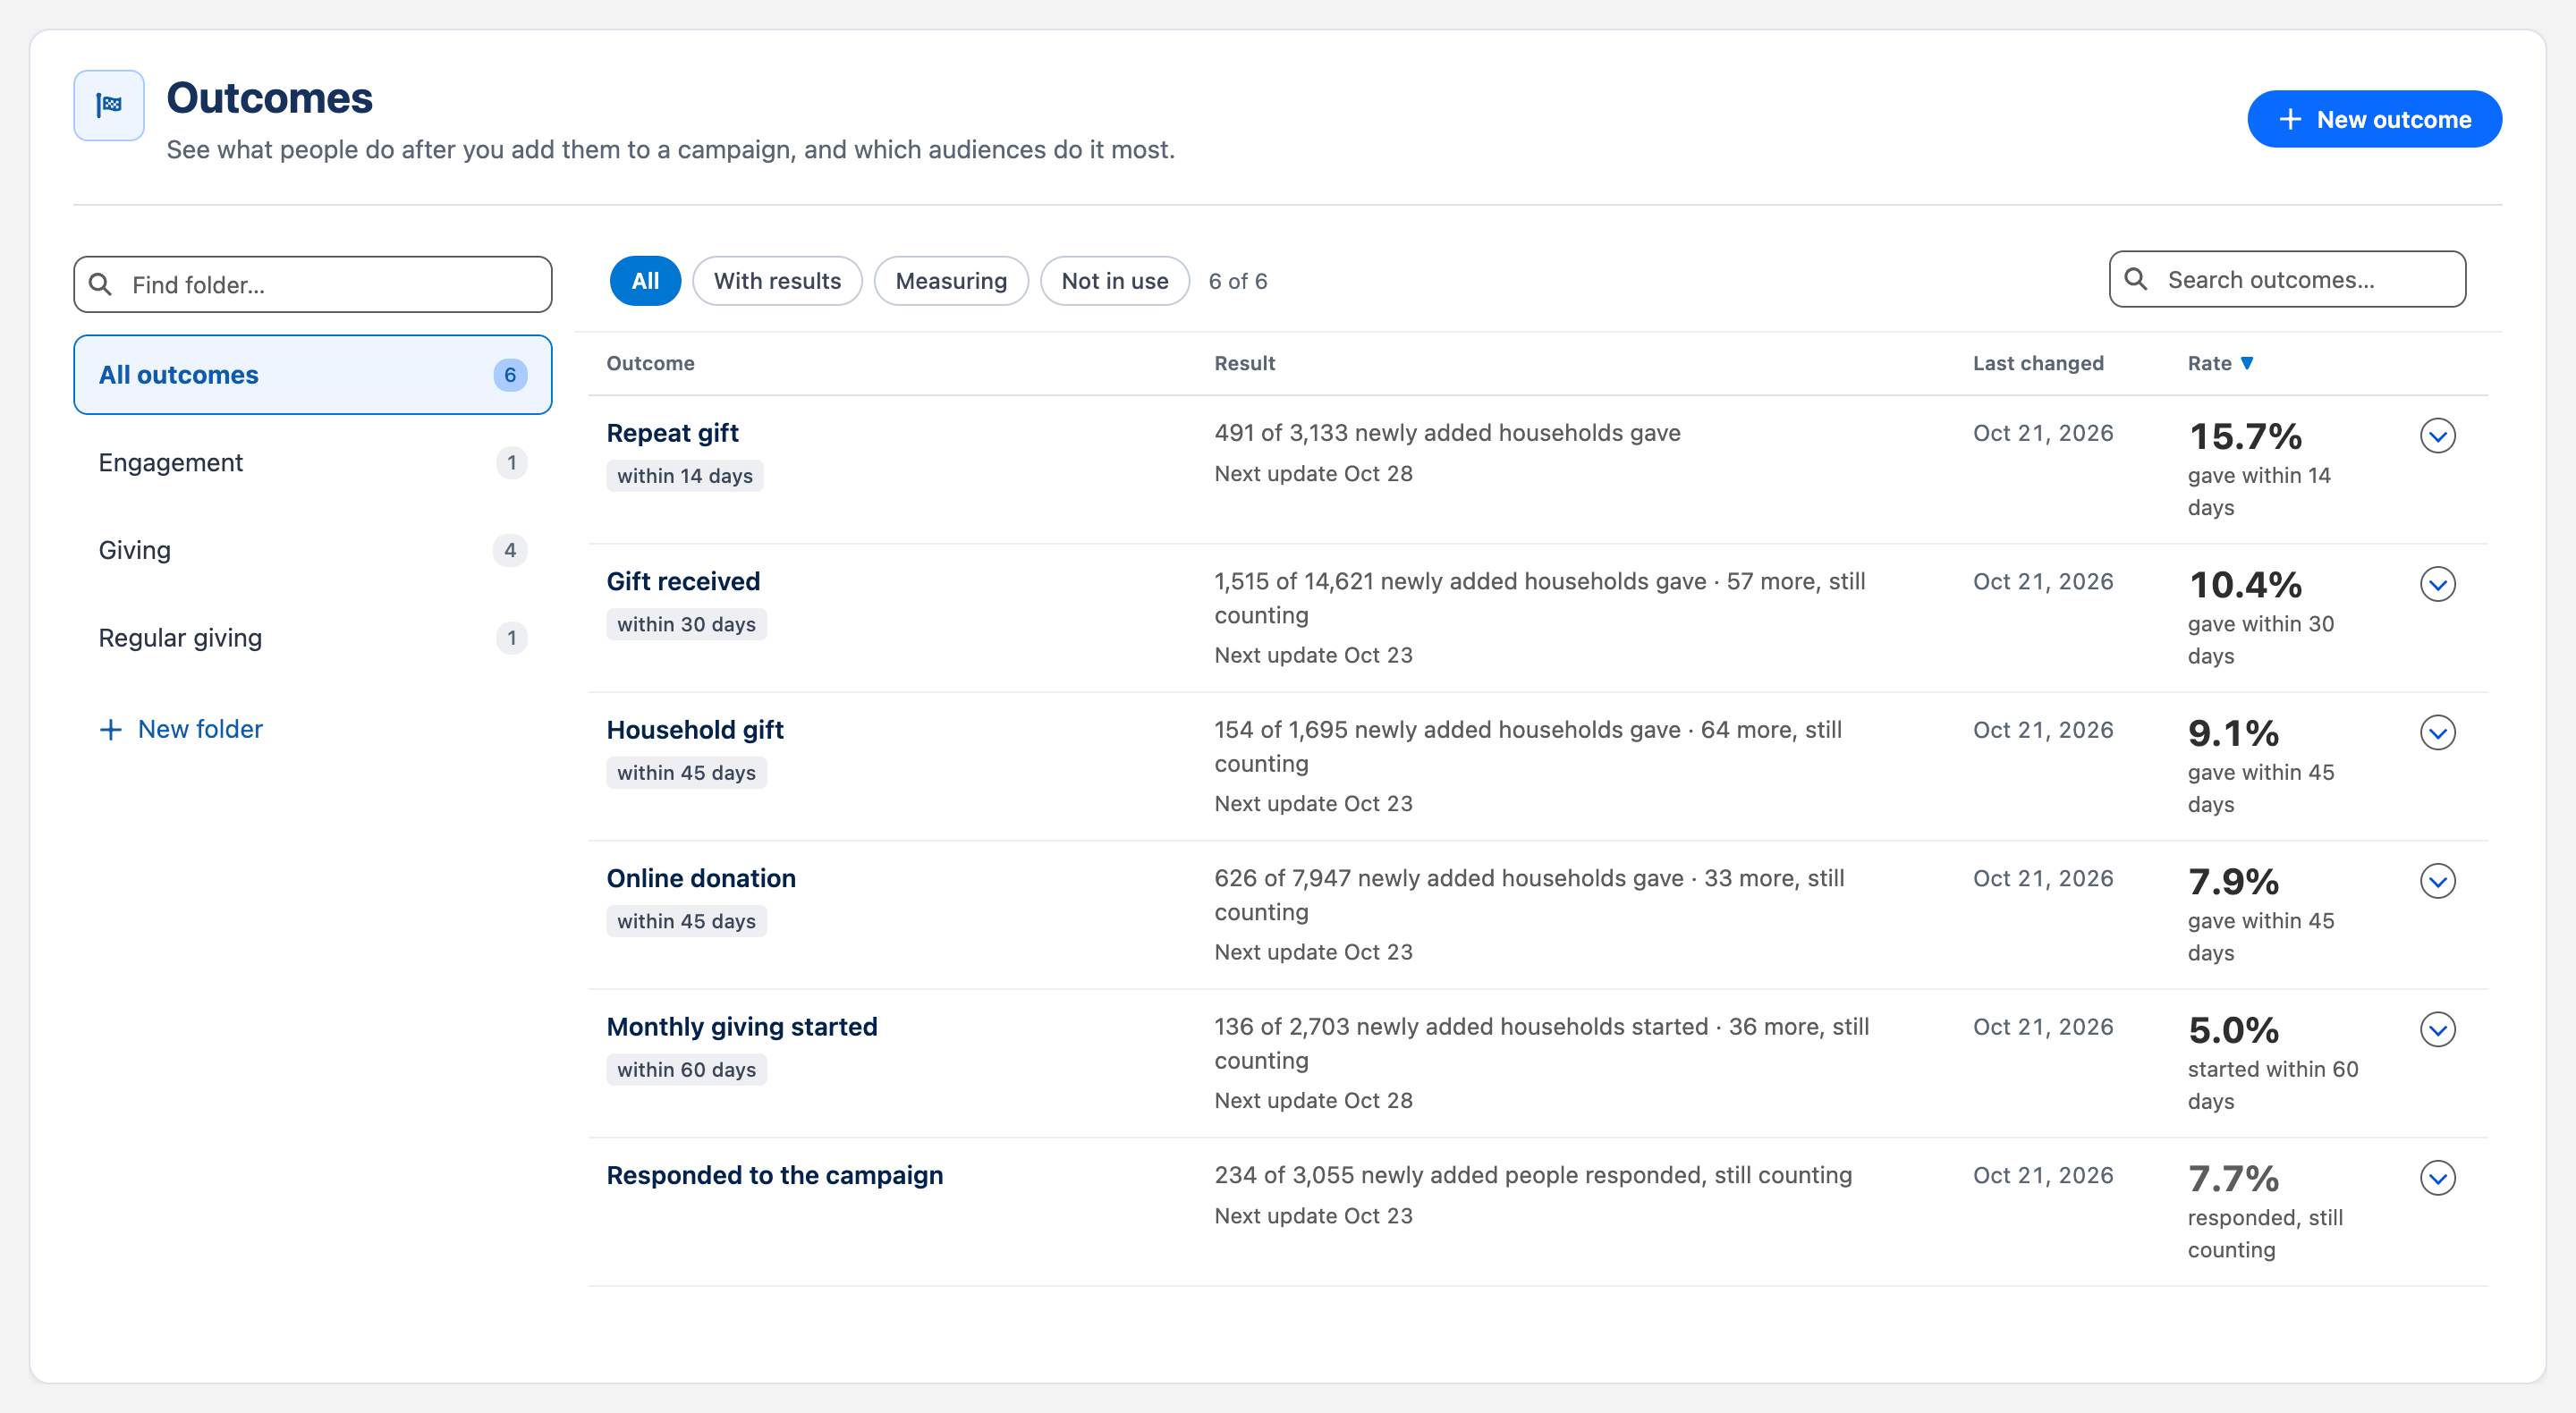
When everyone measured for an outcome is still inside their window, the row shows its rate in grey with gave, still counting. It can still change as more people reach the end of their window.
Below the outcomes with results, two sections follow, each shown when it has outcomes. The Measuring, no results yet section lists outcomes that are set up to be measured but have no results yet. Those already counting people show the date of their next update. The Not in use section lists outcomes that no action measures yet.
Most rows are calculated from the latest updates when you open the tab. For an outcome measured on very many people, CAB shows totals it saved earlier; the row then shows Saved results as of … with their date.
With the Manage outcomes permission, the menu at the end of each row offers Move to folder…, Assign to an action… and Open. Use Assign to an action… to choose which actions measure the outcome. To move an outcome, see Change or delete an outcome.
Open an outcome
Section titled “Open an outcome”Select an outcome’s name to open its page.
The header shows how many actions are set up to measure it, for example Measuring 31 actions. Measurement activity lists the updates already made and what comes next: the next update, and the next run that adds people.
The overall rate at the top sums it up, for example:
10.4% of newly added households gave within 30 days 1,515 of 14,621 newly added households gave. 57 more from actions still counting. Next update Oct 23.
Below it, a note reminds you who is counted: the people each action newly added, or everyone, for a data extension add or final action run once by hand (Counts the people each action newly added. A manual data extension add or final action run counts everyone it includes.). If a campaign add for this outcome keeps a control group, the next line says how many extra conversions it brought, such as 73 more households gave than would have otherwise, and which runs that covers. Without one, the link How control groups work on the page explains how to add one.
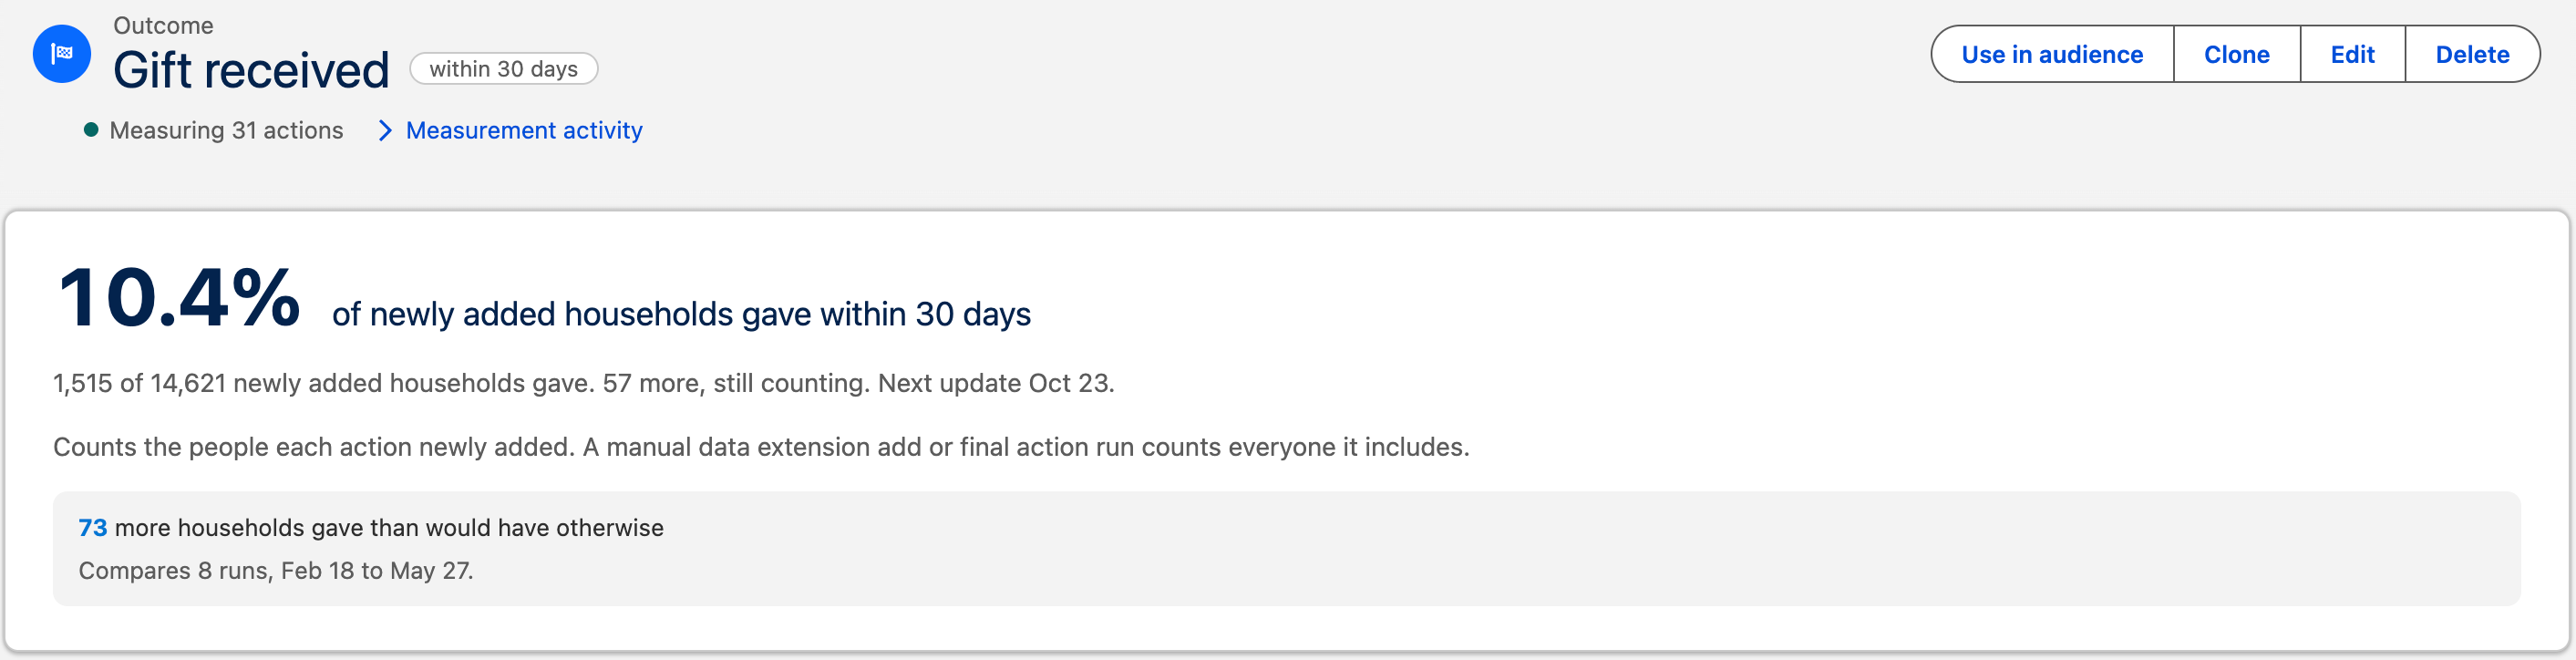
While everyone measured is still inside their window, the top of the page shows, in grey, an early rate from the conversions so far: the same figure as the outcome’s row on the CAB Outcomes tab. On a new gift outcome, for example: 6.2% of newly added households gave, still counting. Until the first results arrive, the cards below show previews of the charts that will appear there, and a note above them says so.
How this is measured at the bottom of the page explains each term: who counts as added, when a person counts as converted, the control group, extra conversions, the update days, and what is not included.
The page has three tabs:
- Results: the charts and your metrics.
- Actions: one row per action and day that measured the outcome, and who converted.
- Definition: what the outcome counts, its date field and window, the update days and where it is measured.
Compare audiences and campaigns
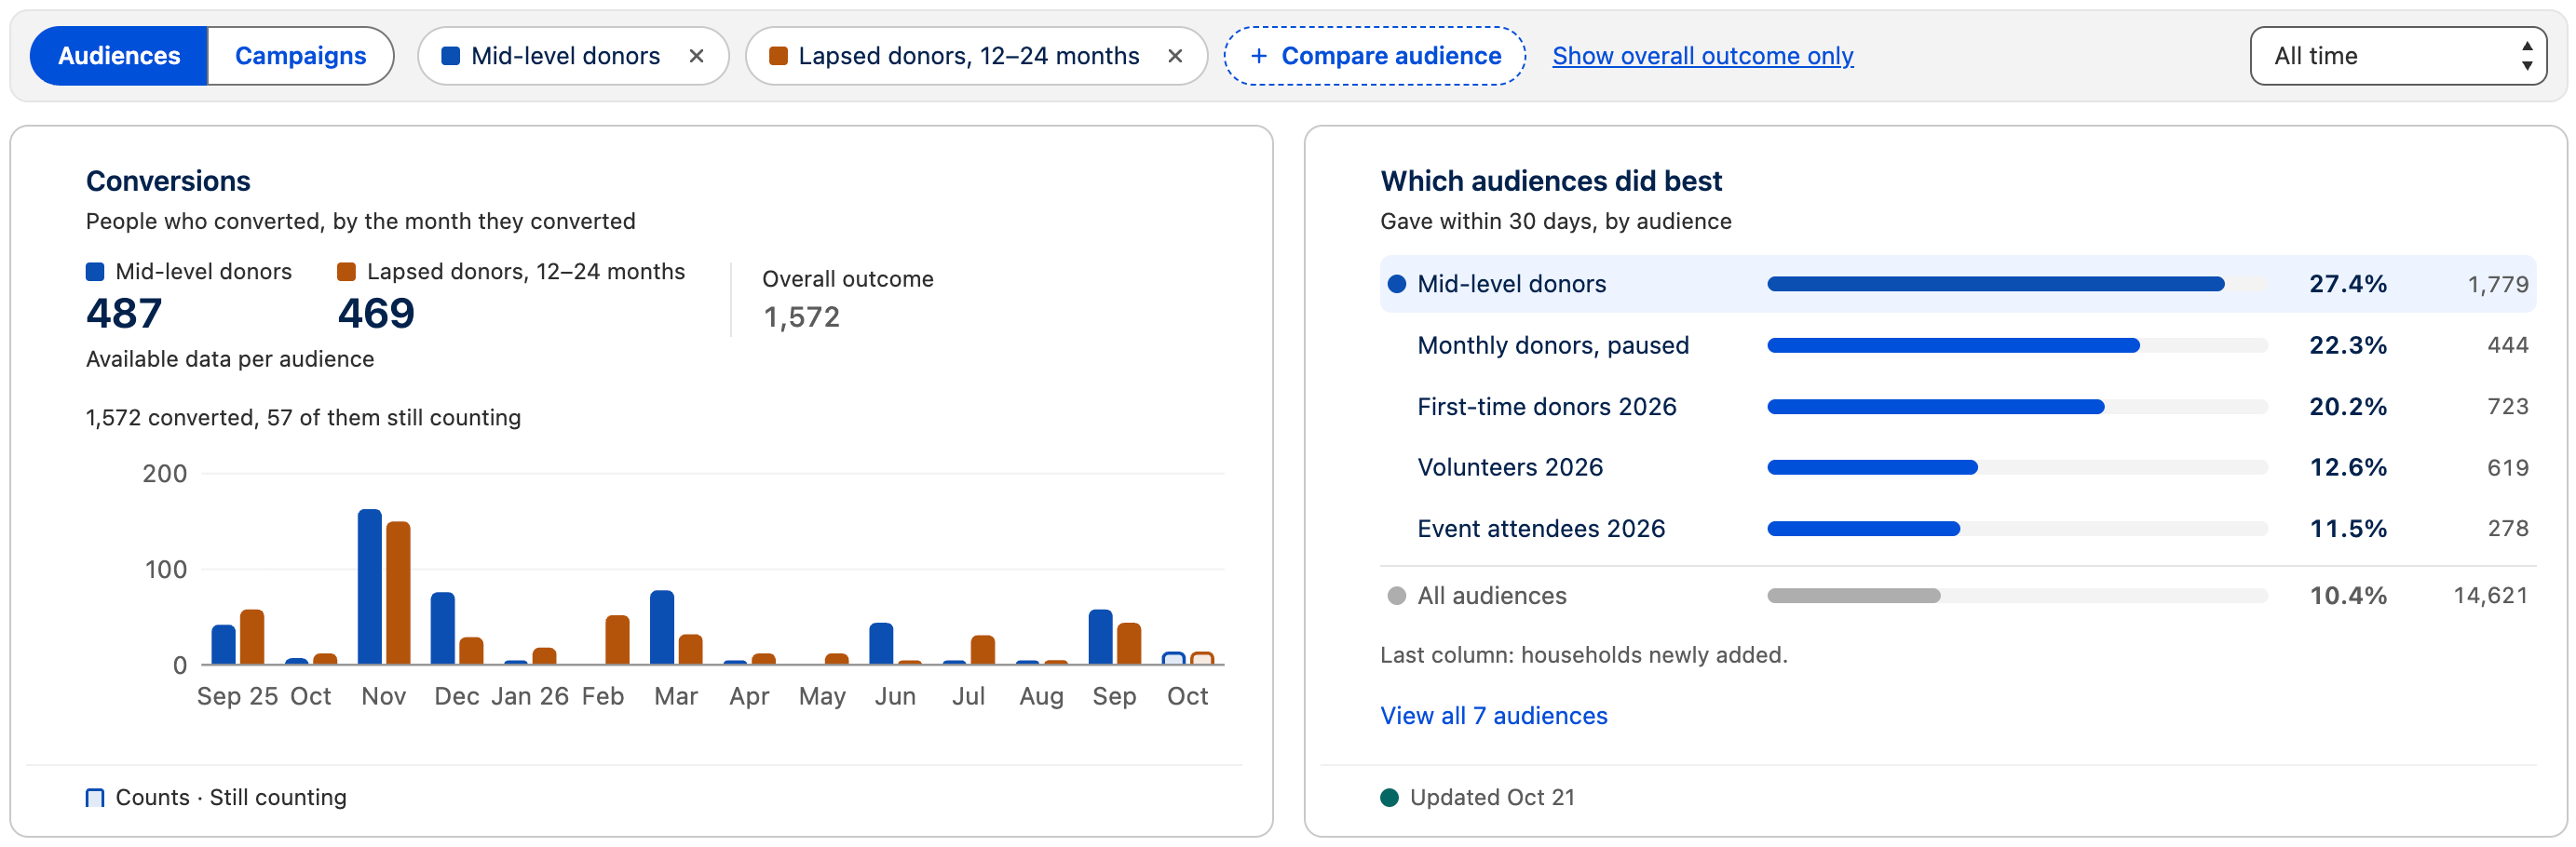
Section titled “Compare audiences and campaigns”At the top of Results, use the Compare bar to choose whether to compare Audiences or Campaigns. Then select Compare audience or Compare campaign and pick up to 6. Every card on the tab then shows one color per selection next to the overall rate, labelled Overall outcome. Show overall outcome only clears the selection.
The audiences or campaigns you select can overlap, for example when one household came from two audiences. So they usually don’t add up to the overall rate.
Audiences you can’t open count in the overall rate but are not listed. A campaign is listed only if you can read it.
Choose a time frame
Section titled “Choose a time frame”At the right end of the Compare bar, pick the time frame for everything on the Results tab: All time, Last 12 months, Last 6 months or Last 3 months. The page opens on All time. On a narrow screen, the time frame picker sits on its own line in the bar.
What counts is when people were added: in the last 12, 6 or 3 months, up to and including today. On October 19, for example, Last 6 months covers the people added from April 20 on. People added before that day are left out, even if they gave during those 6 months. The Conversions card works differently, and some cards start on the 1st of the first month; see below.
What changes when you pick a time frame:
- The rate at the top and the counts under it cover the people added in the time frame, and so does the line about the control group. If the window (for example the 30 days after being added) hasn’t ended for any of them yet, the top says No results for this time frame yet. This is common with short time frames.
- The cards Which audiences did best, Campaign ranking, When people convert and Extra conversions count only the people added in the time frame. One exception: CAB stores older months as monthly totals. If the time frame starts in the middle of such a month, the two rankings count that whole month and say so, for example Audience figures cover actions from Oct 2025 on.
- The Conversions card shows the conversions dated in the months of the time frame, whenever the people were added, so it also counts people added before the time frame who converted during it. Only conversions inside each person’s window count. The first month counts from its 1st day. The card’s total is the sum of those months, so with a time frame it usually differs from the count at the top.
- Your metrics show only the months of the time frame, by the month people were added. A month is shown as soon as part of it falls in the time frame, so the first month can include people added before the time frame starts, back to the 1st of that month.
- On metric cards, Total, Average and Count cover exactly the people added in the time frame, as of last night’s update, and count each gift once. The monthly bars can add up to more, for two reasons: the first bar starts on the 1st of its month, so it can include people added earlier, and a household that two campaigns added in different months has its gift in both months’ bars.
- On metric cards, Smallest and Largest cover all months shown, the first month in full.
- Until the night after your administrator installs a new version of CAB, metric cards show Total, Average and Count for all time, marked All time.
What you compare stays selected when you change the time frame. Cabby’s summary and the CAB Outcomes tab always cover all time.
Read the cards
Section titled “Read the cards”Conversions
Section titled “Conversions”Conversions shows People who converted, by the month they converted. Unlike the rate, it counts everyone who has converted, including people whose window is still open. While some people’s windows are open, the card adds a line such as 1,572 converted, 57 of them still counting. Months that can still grow are drawn as pale columns outlined along the top and sides; the key below the chart reads Counts · Still counting.
Use it to see when gifts actually arrive, for example a peak in November and December around the Year-end appeal 2025. With audiences or campaigns selected, each gets its own column per month.
The control group is not counted here. The card is available for conversion event outcomes; a campaign membership outcome shows its rate without it. See Conversion event or campaign membership.
Which audiences did best
Section titled “Which audiences did best”Which audiences did best ranks the audiences by conversion rate, highest first. In the example, “Mid-level donors” leads at 27.4% against the overall rate, All audiences, at 10.4%. The last column shows how many households each audience newly added.
Very small audiences aren’t ranked, because a few gifts would swing their rate. The card says where the line is, for example Audiences with fewer than 181 newly added aren’t ranked. The line is a quarter of the middle audience size on the card (half the audiences are larger, half smaller), and at least 10. If not every audience fits on the card, select View all … audiences for the full list. Each row shows the rate and how many people it is based on. Small audiences come last, outside the ranking, marked Small group. With fewer than two audiences to rank, the card says Too few audiences to rank yet · all … are under View all. To compare audiences, use Compare audience above.
In Campaigns mode, the card becomes Campaign ranking and ranks campaigns the same way. Its last column shows how many people each campaign newly added. It shows the best five, for example Best 5 of 7 campaigns, and when not every campaign is on the card, View all (…) lists them all.
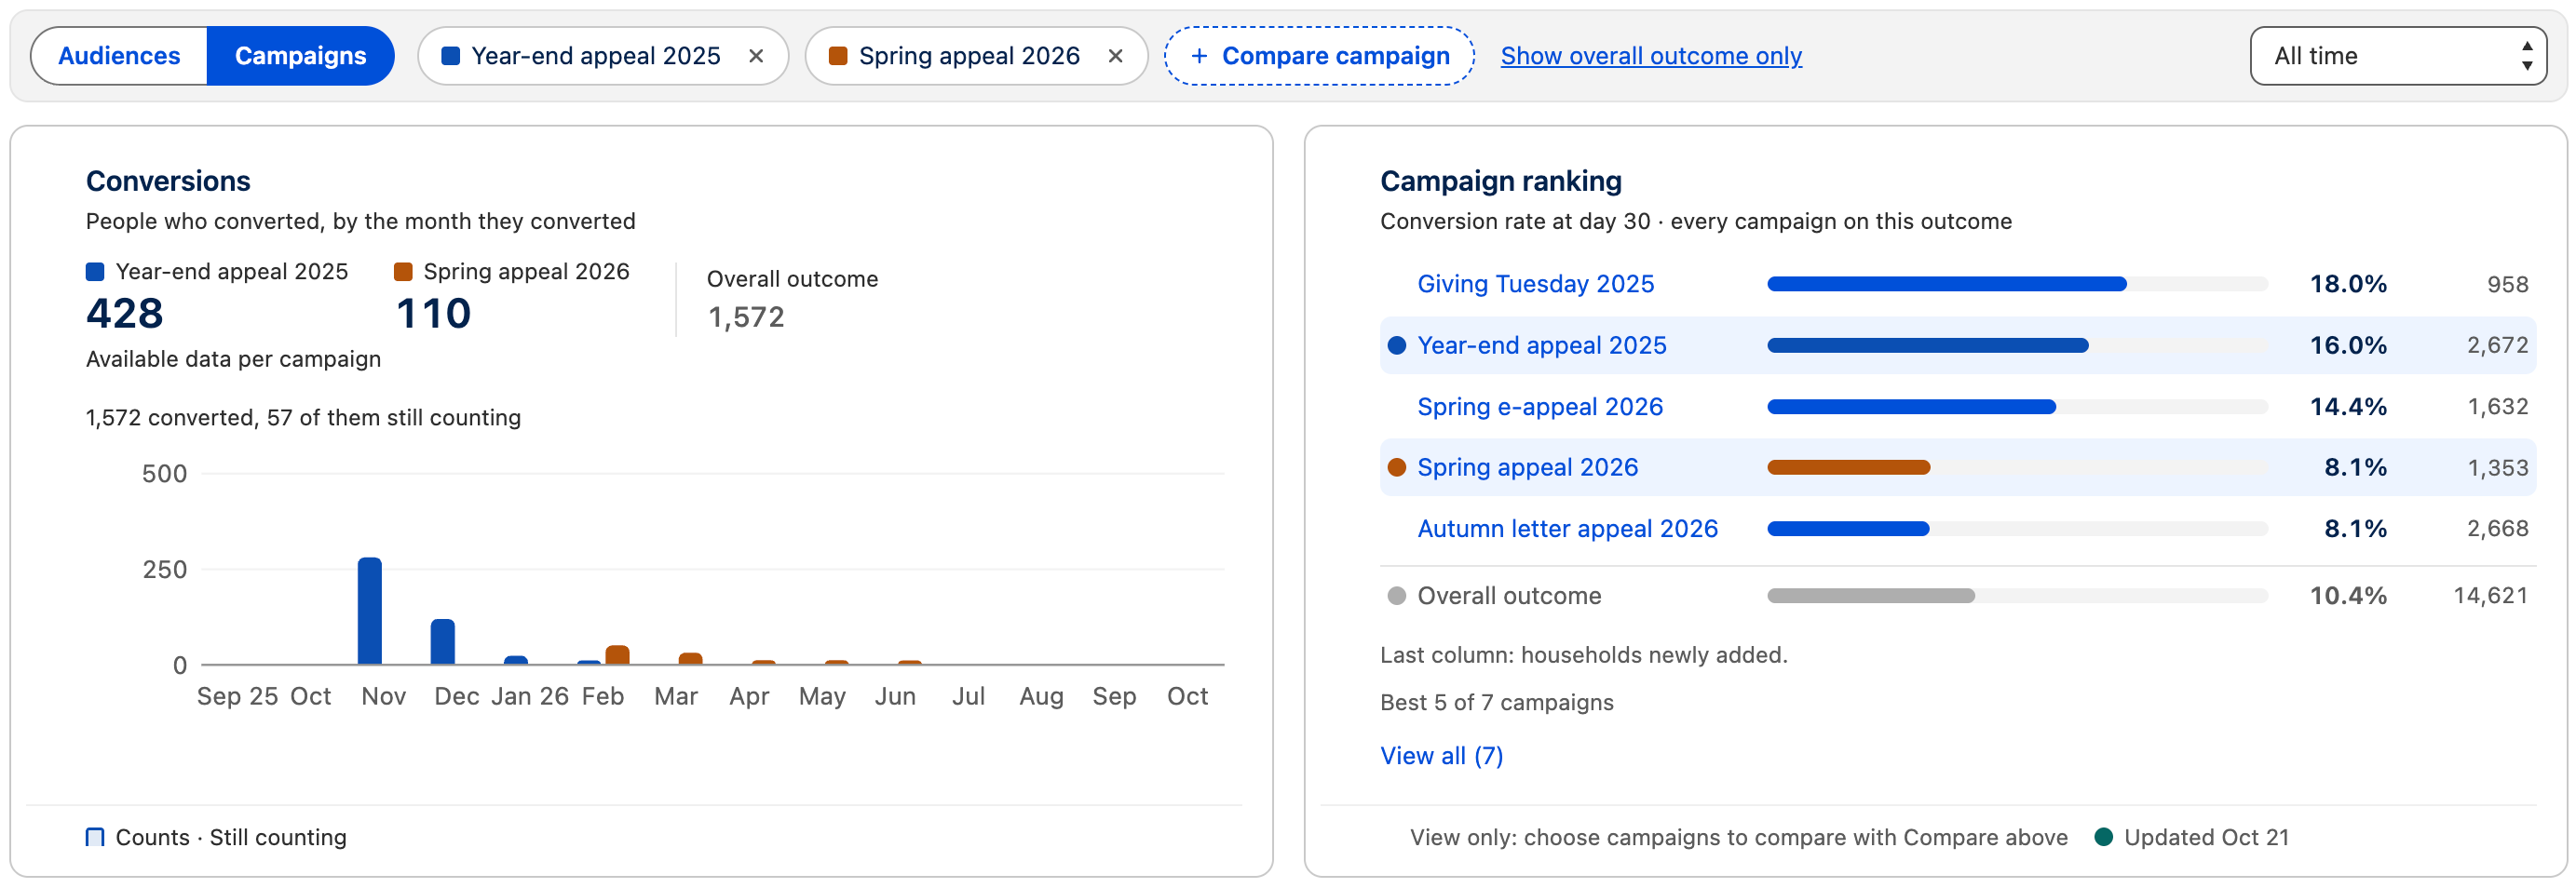
To judge a rate, compare it with All audiences on the same card rather than with a fixed number. A rate is final once the window and the last check are over for everyone in it.
When people convert
Section titled “When people convert”When people convert, or When people give for gift outcomes, shows how many days after being added people converted, for example “Most did so between day 3 and day 12.” Use it to time a reminder: if most gifts arrive in the first two weeks, a follow-up on day 15 reaches the people who haven’t given yet. To build that follow-up, see Act on results.
Extra conversions
Section titled “Extra conversions”With a control group, Extra conversions shows how many more people converted because of the campaign. It gives one of three answers: “73 more …”, No clear difference yet, or “30 fewer …”. See Read the answer.
Add your own metrics
Section titled “Add your own metrics”Rates count people. Metrics measure the records behind the conversions, such as the total amount given. Metrics are available for conversion event outcomes, such as Gave a gift; see Conversion event or campaign membership. With the Manage outcomes permission, select Add metric:
- Pick a suggestion under Suggested for …, such as the average gift, or build your own under Or build your own.
- Under Or build your own, choose in the first list what to calculate: Total, Average, Smallest, Largest or Count.
- For all but Count, pick a number, currency or percent field of the conversion record, or of a record linked to it, up to two links away. For Count, choose under Count per whether to count each gift or each household, when there is a choice.
- Name it and select Add metric. The sentence below the name says what the metric will show.
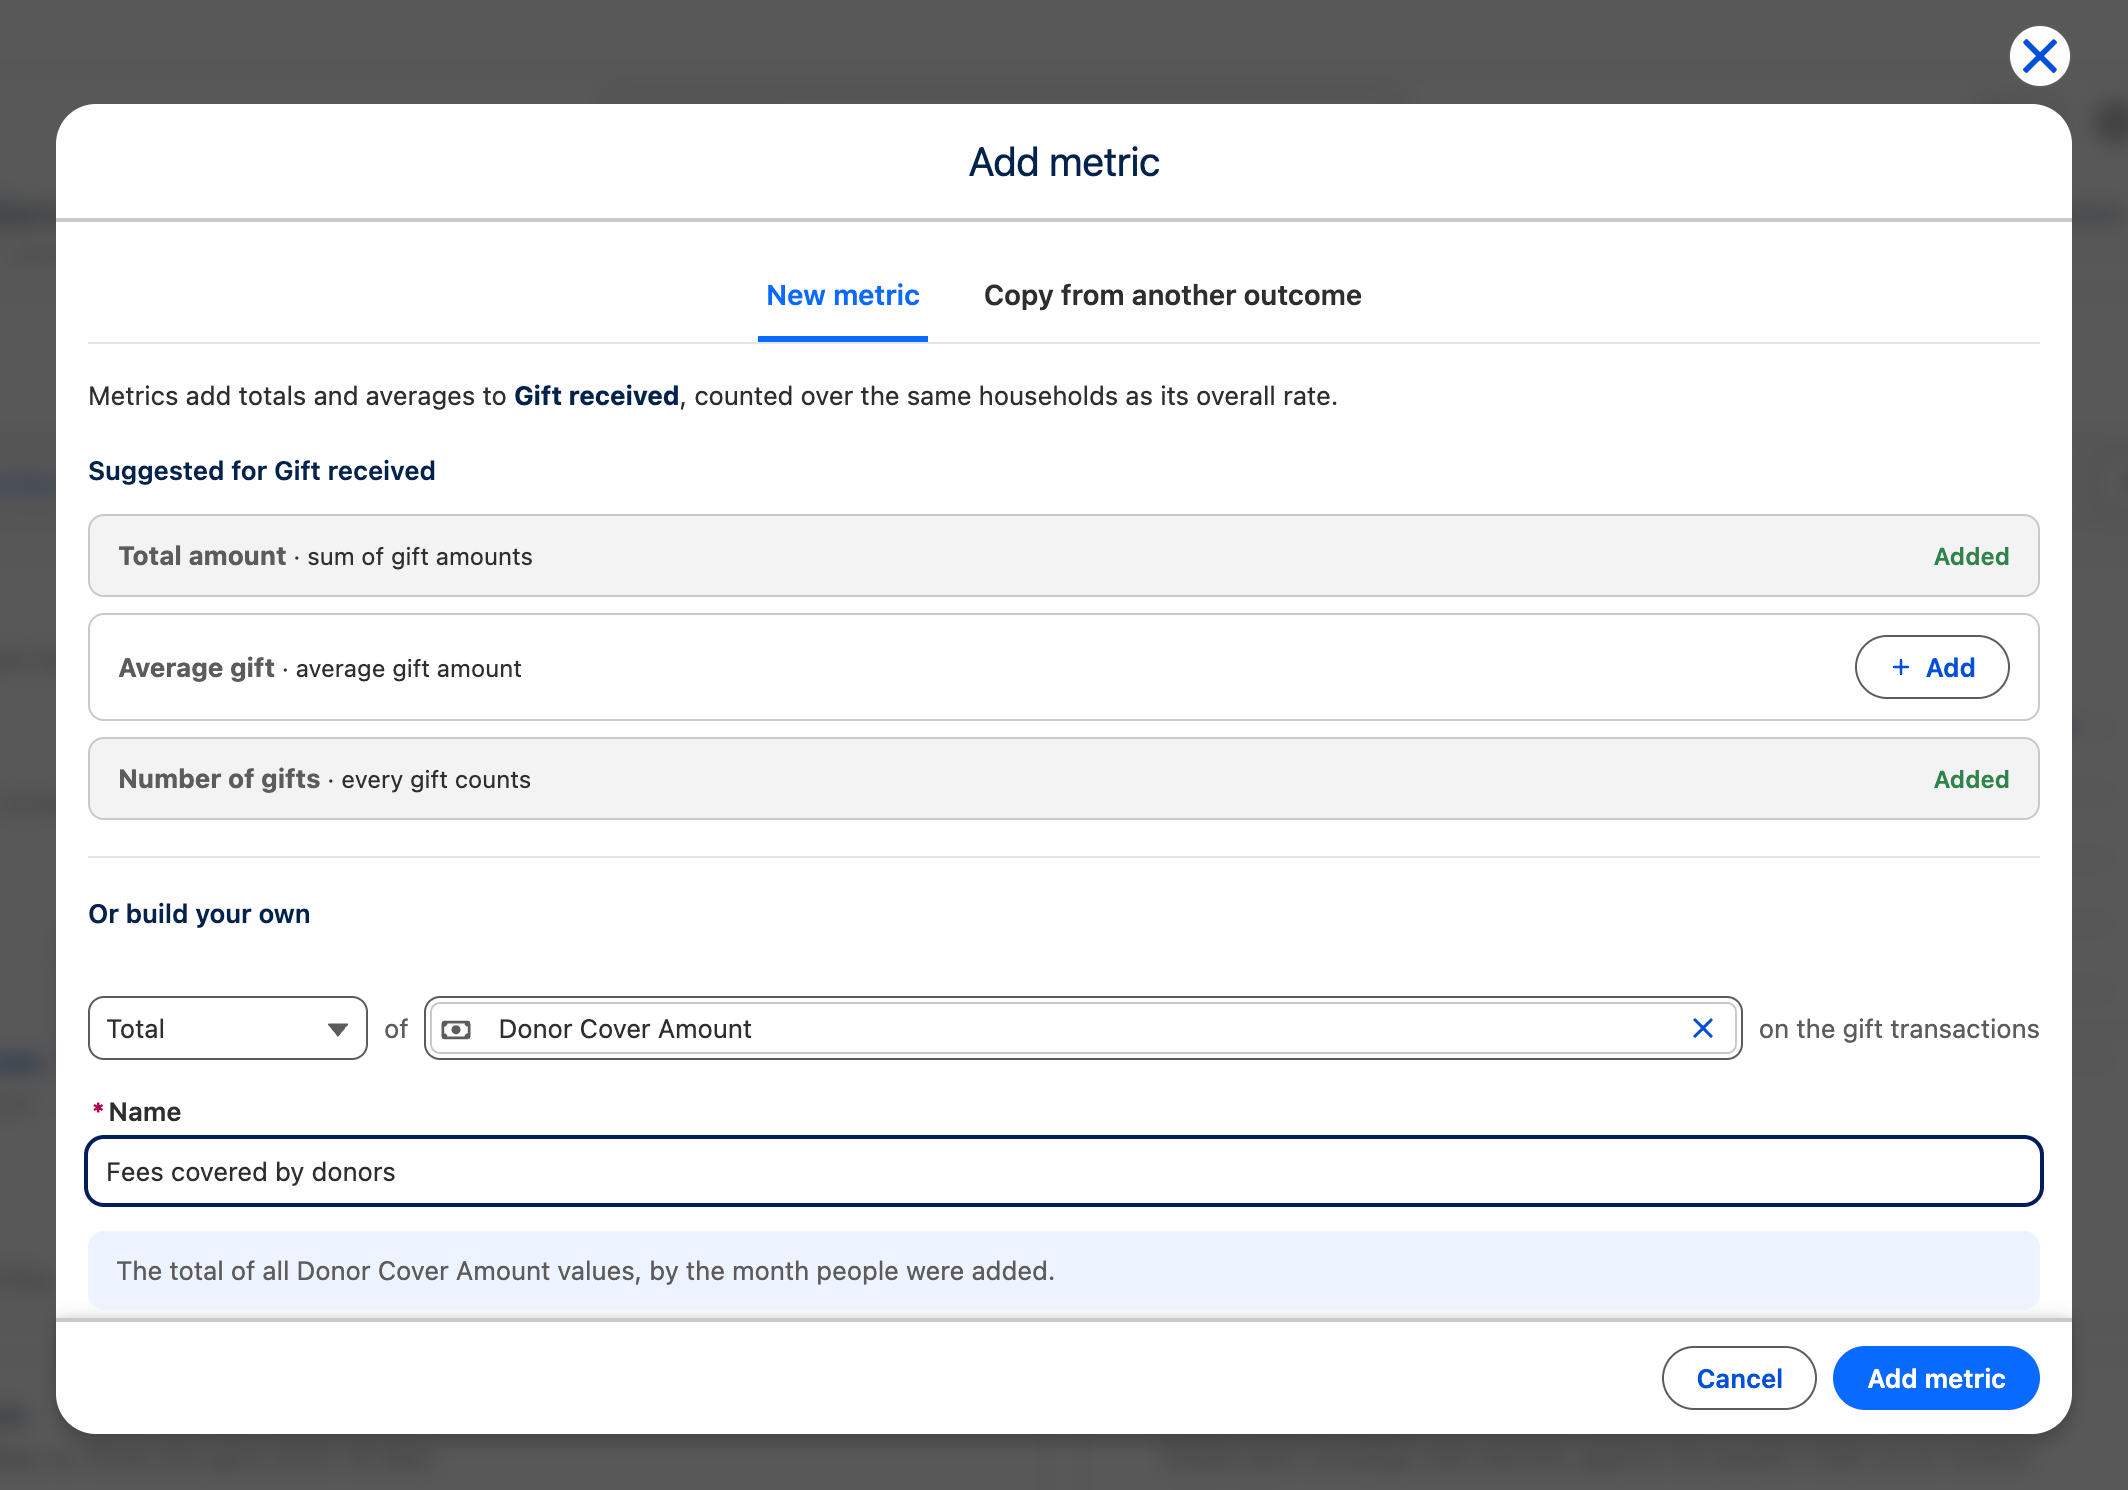
For example, a total of the donor cover amount named “Fees covered by donors” shows how much donors added to cover fees.
Under Copy from another outcome, you can reuse a metric from another outcome that counts the same records. The copy uses this outcome’s own rules, window and people, so its results differ from the original.
Each metric gets its own card and follows the audiences or campaigns you compare. Note the time axis: metric cards show months by when people were added, while the Conversions card shows months by when they converted. Use the Conversions card to see when gifts arrived; use metric cards to compare the people added each month. Totals and counts are drawn as columns, averages, smallest and largest values as lines. A month whose people are still inside their window can still change: on a column chart it is a pale column outlined along the top and sides, with the key Still counting; on a line it is a hollow point, with the key Hollow point: still counting. To see only recent months, pick a time frame; see Choose a time frame. Metrics are calculated every night, so a new or changed metric shows its results the next morning.
A metric is the same for everyone who views the outcome. Dragging the cards changes their order for everyone too.
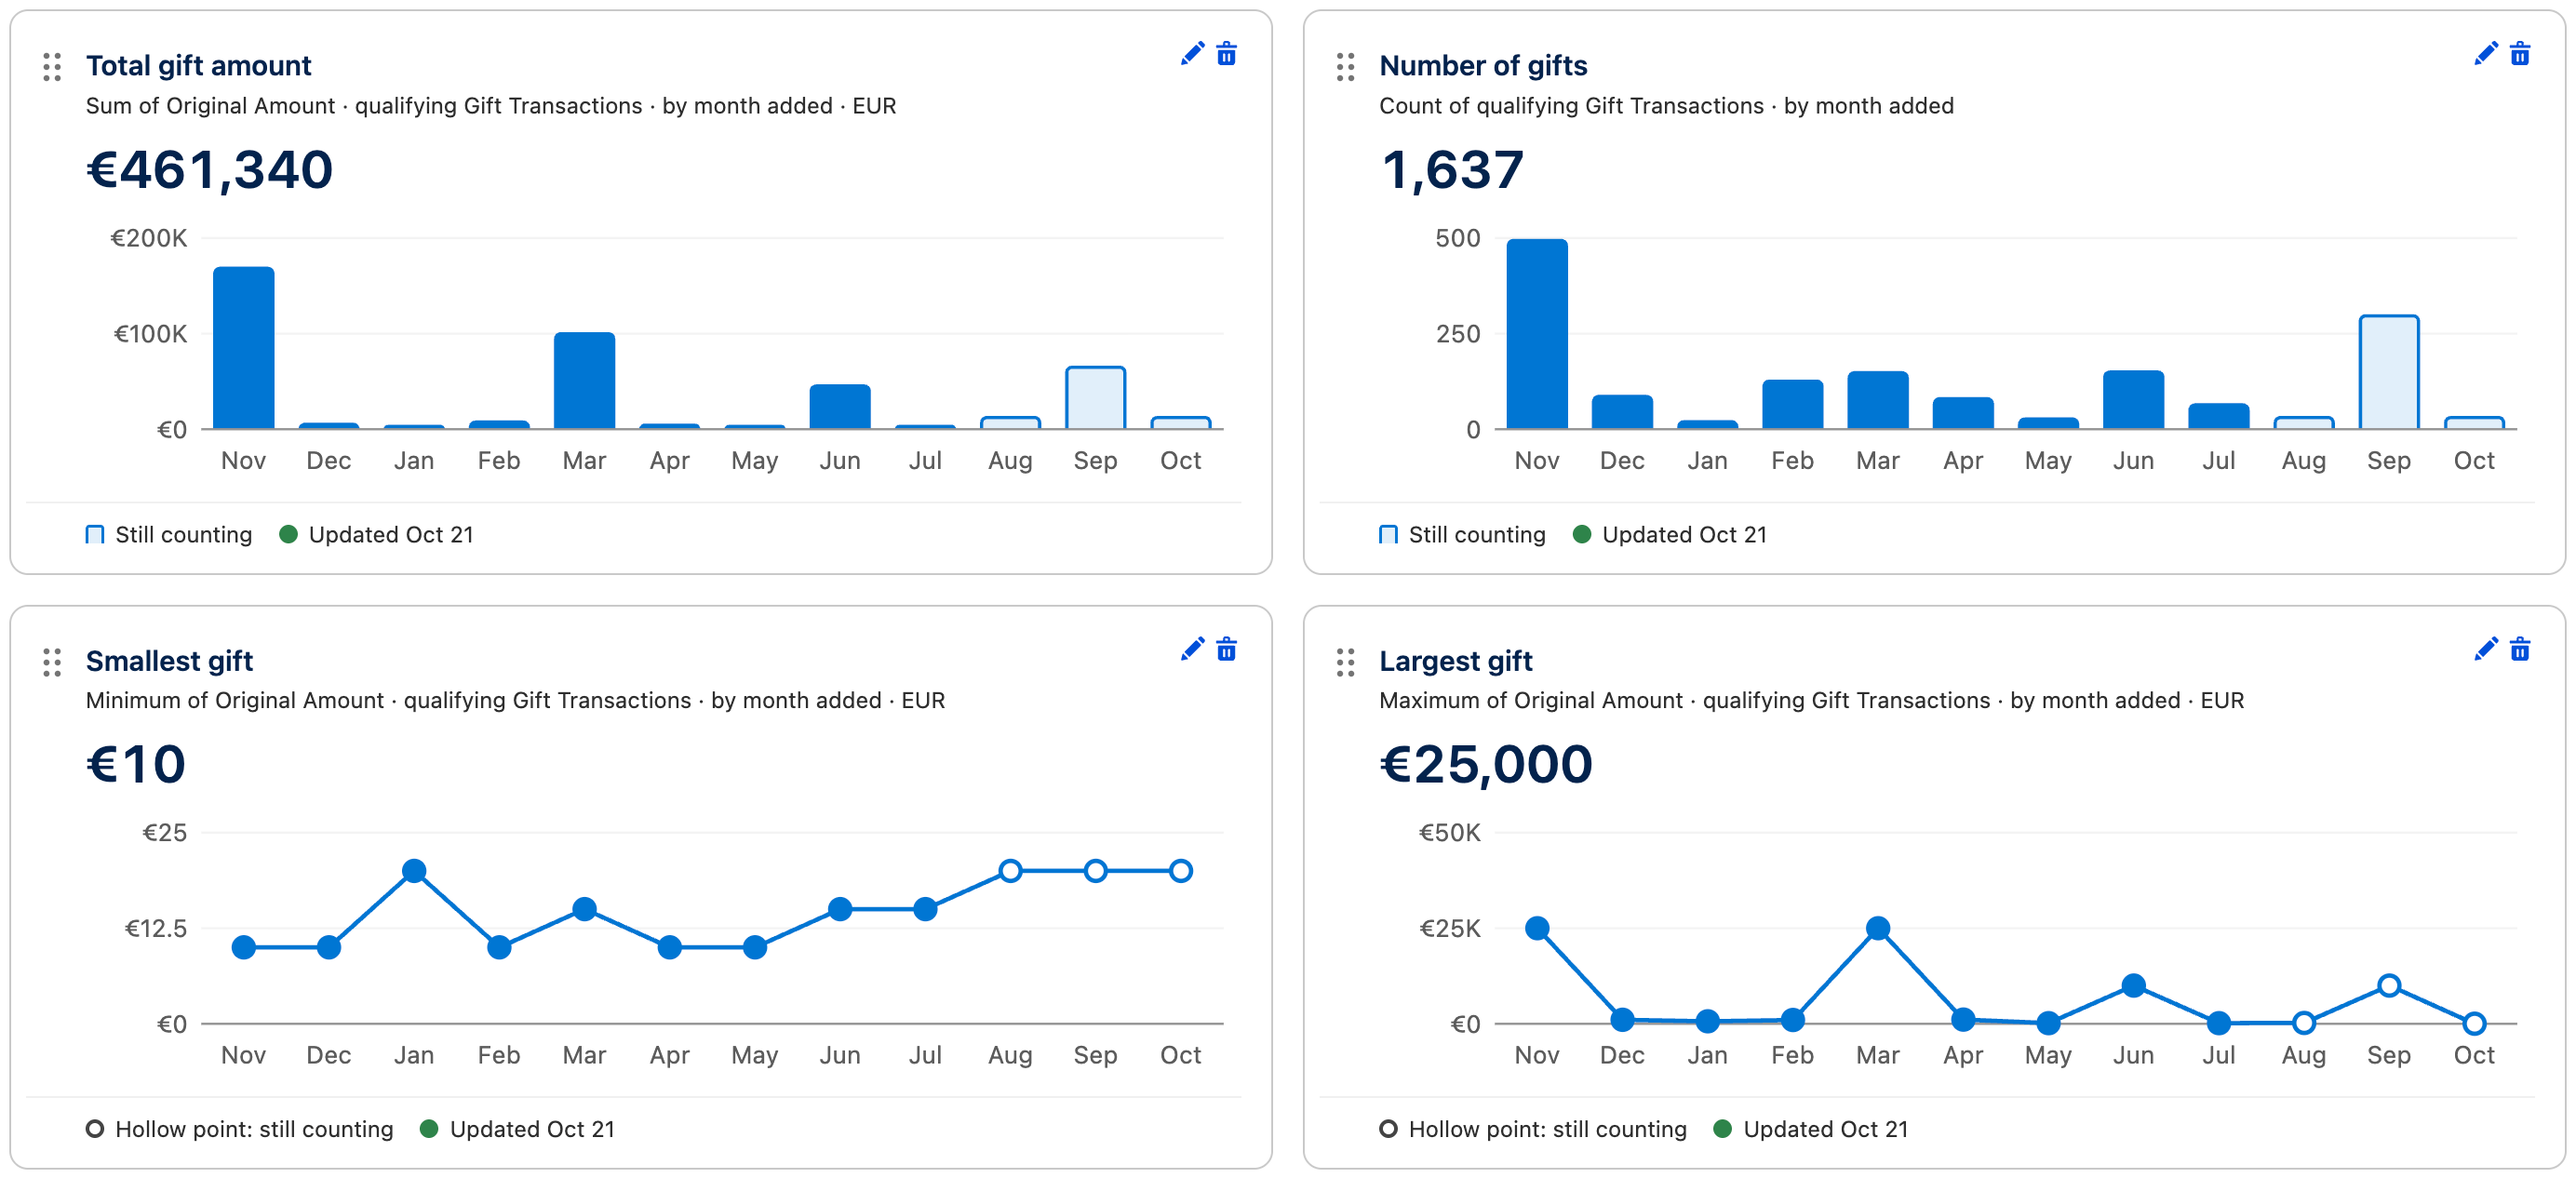
Seeing metric results needs the Outcome Metric Results permission. Without it, a notice above the metric cards says Custom metric results need the Outcome Metric Results permission, each metric card shows a lock, and the other cards still show.
A gift linked to two audiences counts in each of them, but only once in the overall outcome. So the audiences or campaigns can add up to more than the overall total.
Check who converted
Section titled “Check who converted”On Actions, each row is one action on one day: when people were added, the audience, the campaign or list they were added to, how many were added and converted, the rate, and the next update. Filter by audience, campaign and date.
Select View to see the people of that row. Under Show day, pick an update; switch between All and Converted. For each person, Evidence links to the record that made them count, such as the gift, with its Evidence date. You only see people and records you have access to in Salesforce.
CAB keeps the list of measured people until their last update, plus the time your administrator set. After that, the row shows The list of measured people for this action is no longer kept. Campaign members and results are unchanged.
Check one run in run history
Section titled “Check one run in run history”An audience’s Run History says in each run’s row how many of its actions measure outcomes, for example Outcomes measured on 1 of 2 actions, or Outcomes measured on this run’s action when the run has a single action. It shows a Measurement column for campaign adds and a measurement line for data extension adds and final actions:
| You see | Meaning |
|---|---|
| Waiting for the first update | People were added; the first update is still ahead. |
| 42% at day 14 | The latest result. Next to it, day 30, still counting shows that the next update is still ahead. |
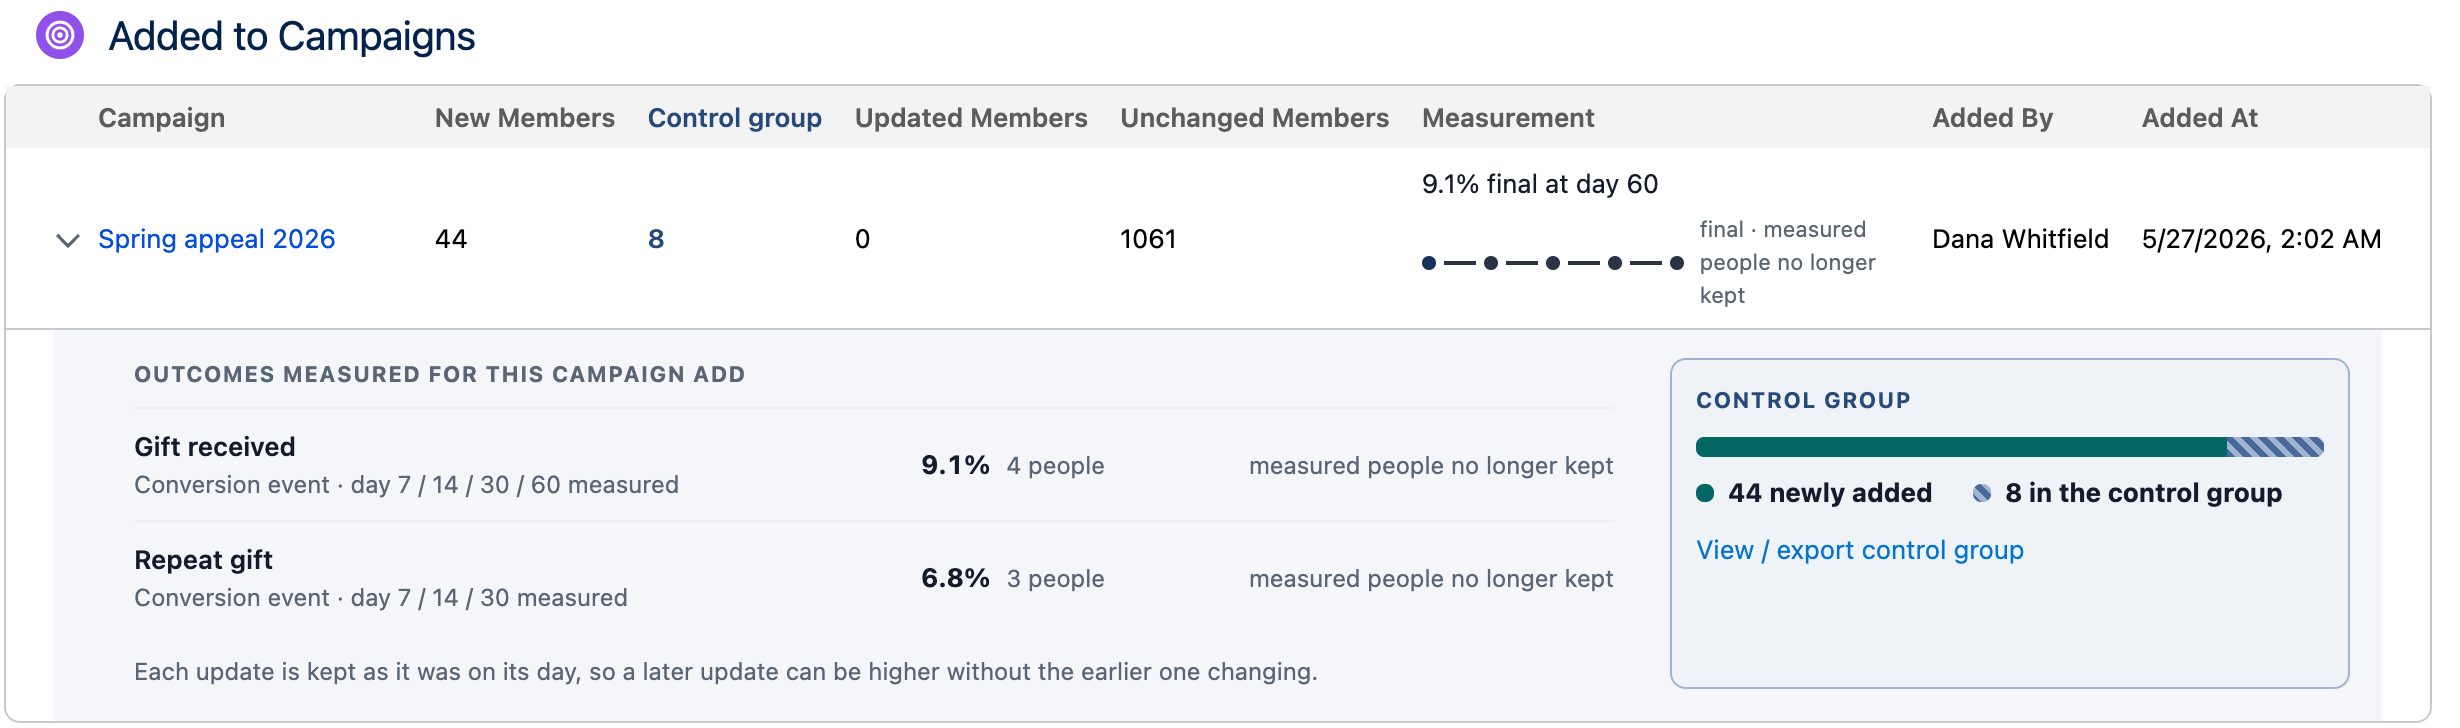
| 9.1% final at day 60 | The window and the last check are over. The result won’t change. |
| Nobody new was added | The run only reached people who were already there. |
| Not measured: … | Why nobody from this run is counted, for example that outcome storage was at its limit or the action could not tell who was new. |
| Update due, not measured | The nightly update is not scheduled. Ask an administrator. |
Expand a campaign add to see Outcomes measured for this campaign add: each outcome with its rate, the update days it has a result for, and a View link to its people while they are kept. Each outcome lists its own days. In the example below, Gift received, which counts within 30 days, reads day 7 / 14 / 30 / 60 measured, and Repeat gift, which counts within 14 days, reads day 7 / 14 / 30: its last check is on day 30. A campaign add with a control group also shows the Control group column and its comparison; Only runs with a control group filters the list to those runs.
See an audience’s outcomes
Section titled “See an audience’s outcomes”To see which outcomes measure an audience, open the audience in the audience builder and select Details. When at least one outcome measures the people its campaign adds reach, the Outcomes section lists them: Measuring while one of the audience’s campaign adds still measures the outcome, otherwise Earlier results. Below each outcome, a line names the campaign add it measures on, such as Added to Autumn letter appeal 2026 every week. Measuring outcomes come first; past five, View all (…) shows the rest. Select an outcome’s name to go to the outcome’s page with this audience selected under Compare audiences.
See new updates on the home tab
Section titled “See new updates on the home tab”When an outcome has a new update for one of your audiences, the Campaign Audience Builder home tab says so with a pill at the bottom right, for example 14 outcome updates. An update stays in the list until you mark it as seen or open the outcome’s page with that audience selected. Updates older than 30 days aren’t shown. When there is nothing new, there is no pill.
Select the pill to see the updates. They are grouped by outcome, the outcome with the newest update first, and then by audience. Each audience has at most two rows:
- The newest people at their latest update, for example “added in Sep · 1.7% converted within 14 days”. People added on a schedule are grouped by the month they were added; people added once show the day, as in “added Oct 17”.
- The latest result: the most recent month whose window is over, for example “added in Aug · 13.3% converted within 45 days” on an outcome that counts conversions within 45 days. For people added once, this is the same row once their window is over.
The sentence uses the outcome’s own word, such as “gave” for a gift outcome or “converted” for a custom outcome.
At the right of a row, an arrow and a figure show how the rate moved, per 100 newly added. For people added on a schedule, the row is compared with the people added the month before, at the same day after being added, as in “▲ 2.0 vs Aug”. For people added once, it is compared with their own previous update, as in “▲ 1.5”. A falling figure is orange. Point at the figure to read the comparison in full. A first update has nothing to compare with, so it shows no figure. With a control group, a change of the answer, for example from No clear difference yet to more conversions than would have happened otherwise, is also an update.
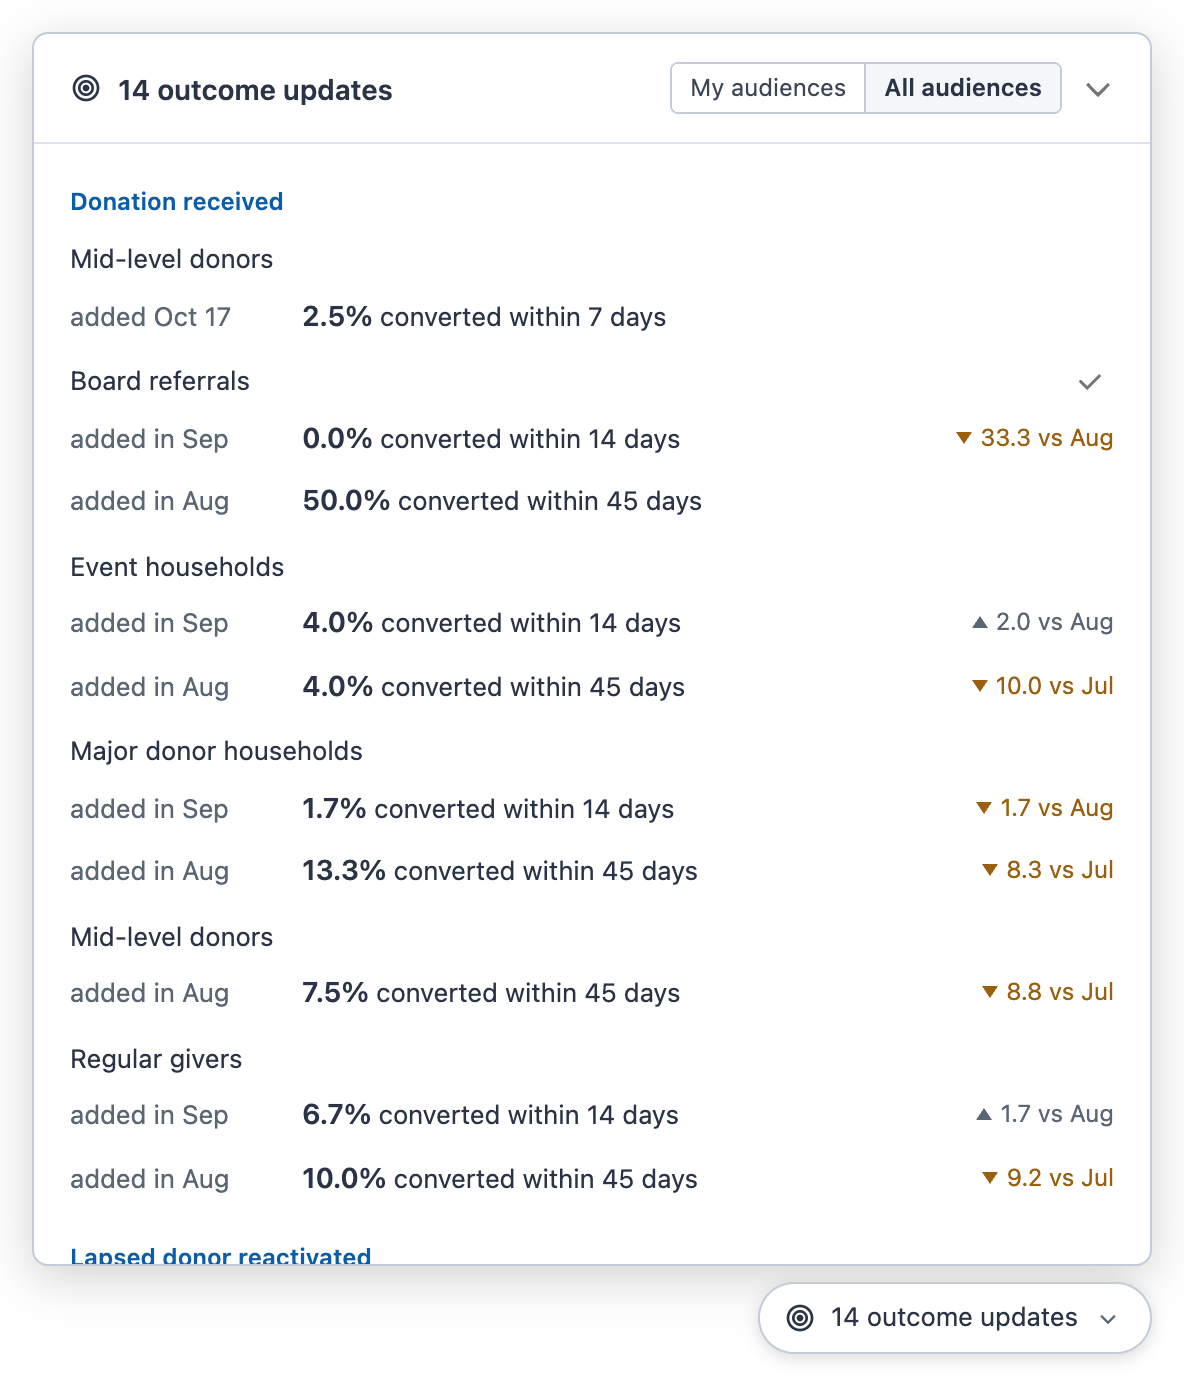
In the panel:
- Choose My audiences to see the audiences you created or whose actions you set up, scheduled or run once. Choose All audiences to see every audience you can see. The count on the pill follows your choice, and your browser remembers it.
- Select a row to open the outcome’s page with that audience selected under Compare audiences. Select an outcome’s name to open its page for all audiences. Either way, the updates that page shows are marked as seen and leave the list.
- Point at an audience and select the check mark, Seen, to mark its updates for that outcome as seen. If the same audience also has updates for other outcomes, those stay in the list. All seen at the end of the list marks every update in the list as seen.
- What you mark as seen is marked for you only; everyone else keeps their own list. Once you have marked an audience’s update as seen, the audience comes back to the list only with a newer update. Nothing is hidden: the outcome’s page still shows every result.
- Select Collapse, or the pill again, to close the panel.
With a very large number of updates, the pill shows a lower bound, such as 500+ outcome updates.
See a campaign’s outcomes on its record page
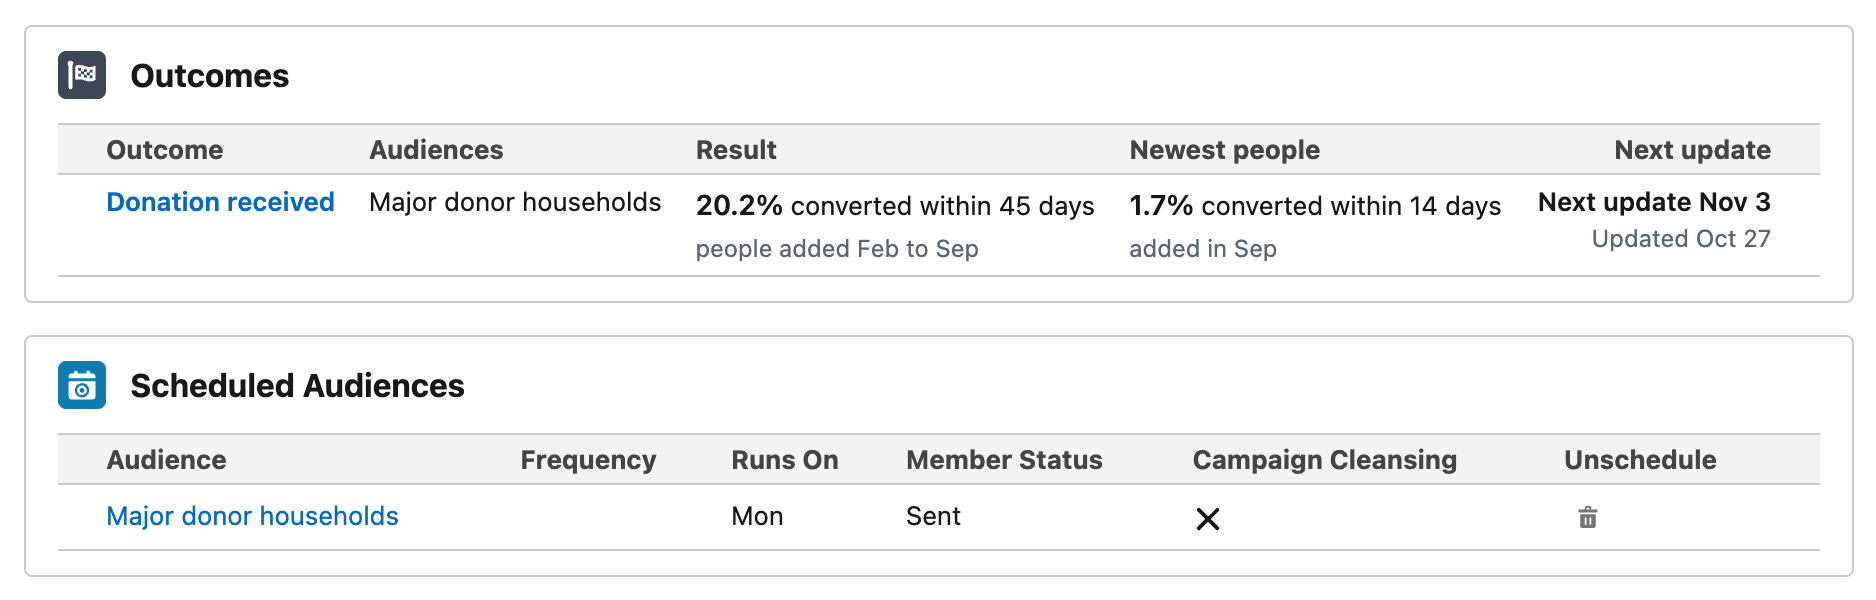
Section titled “See a campaign’s outcomes on its record page”When the CAB Campaign Suite is on the campaign record page and at least one outcome is measured on the campaign, the Outcomes card sits above Scheduled Audiences. It has one row per outcome:
| Column | Shows |
|---|---|
| Outcome | The outcome’s name. Select it to open the outcome’s page. |
| Audiences | The audiences whose campaign adds to this campaign measure the outcome: the first one, then how many more, as in “· +2”. Point at it to see them all. |
| Result | The campaign’s rate for everyone whose window is over, all audiences together, the same figure as in the outcome’s Campaign ranking. Beneath it, who that covers, for example “people added Feb to Sep”. People still inside their window aren’t in it yet. Before anyone’s window is over, it says Waiting for the first update and when the people were added. |
| Newest people | The people added most recently, at their latest update, for example “1.7% converted within 14 days” for the people “added in Sep”. Empty for people added once, whose only figure is the result. |
| Next update | When the next update is due, for example “Next update Nov 3”, or “First update Oct 28” before the first one. Finished when no update is ahead. Beneath it, the date of the latest update, such as “Updated Oct 27”. |
Select the figures in a row to open the outcome’s page comparing campaigns, with this campaign selected.
Use the results outside the outcome’s page
Section titled “Use the results outside the outcome’s page”Outcome results are read on the pages described here. To work with the people behind a result in Salesforce, build an audience from it with an outcome filter, then add it to a campaign and report on the campaign, or export it. See Act on results. CAB includes no Salesforce report types for outcome results.
Ask Cabby what changed
Section titled “Ask Cabby what changed”When your administrator has given Cabby access to outcome data, the outcome’s page shows Cabby’s summary. Select Ask Cabby what changed. Cabby reads the outcome’s figures, and its metrics when you can see them, and lists its findings, for example which audience pulled the rate up. A finding can offer Add to Compare or Show card to take you to the evidence, and Next: suggests a step. The summary states the date of the figures it read; ask again after new updates. Before you act on a finding, check it with Show card.
When there is not enough data yet, Cabby says so.