

Measure what happened after activation
Close the loop
Define success once and CAB automatically measures each listening activation at your chosen checkpoints. Results appear both in the organization-wide CAB Outcomes tab and alongside the audience run that produced them.
Nightly measurement · Campaign + other destinations · Setup required
Create an outcome
Section titled “Create an outcome”- Open CAB Outcomes. For a quick start, choose Responded to campaign and Create outcome. Or select New outcome; templates include Opportunity won within 60 days, Became a donor, and Custom outcome.
- On Basics, enter Name, choose Outcome type—Status-based or Conversion event—and select the Cohort entity.
- For a conversion event, continue to Define what counts as a conversion. Choose A related record appears or The … itself qualifies, then build the rule.
- On measurement, set the Conversion window (days), Checkpoint schedule (days), and Listening scope. Use Listen on all compatible campaign actions (org default) when appropriate.
- Select Save outcome.
Choose outcomes during activation setup
Section titled “Choose outcomes during activation setup”Scheduled action setup now includes Tracked outcomes with Outcomes to measure and the placeholder Search outcomes. Outcomes configured as organization defaults appear as Always tracked: …. Pardot sync settings expose the row action Tracked outcomes and modal Track outcomes for this sync.
Read the results
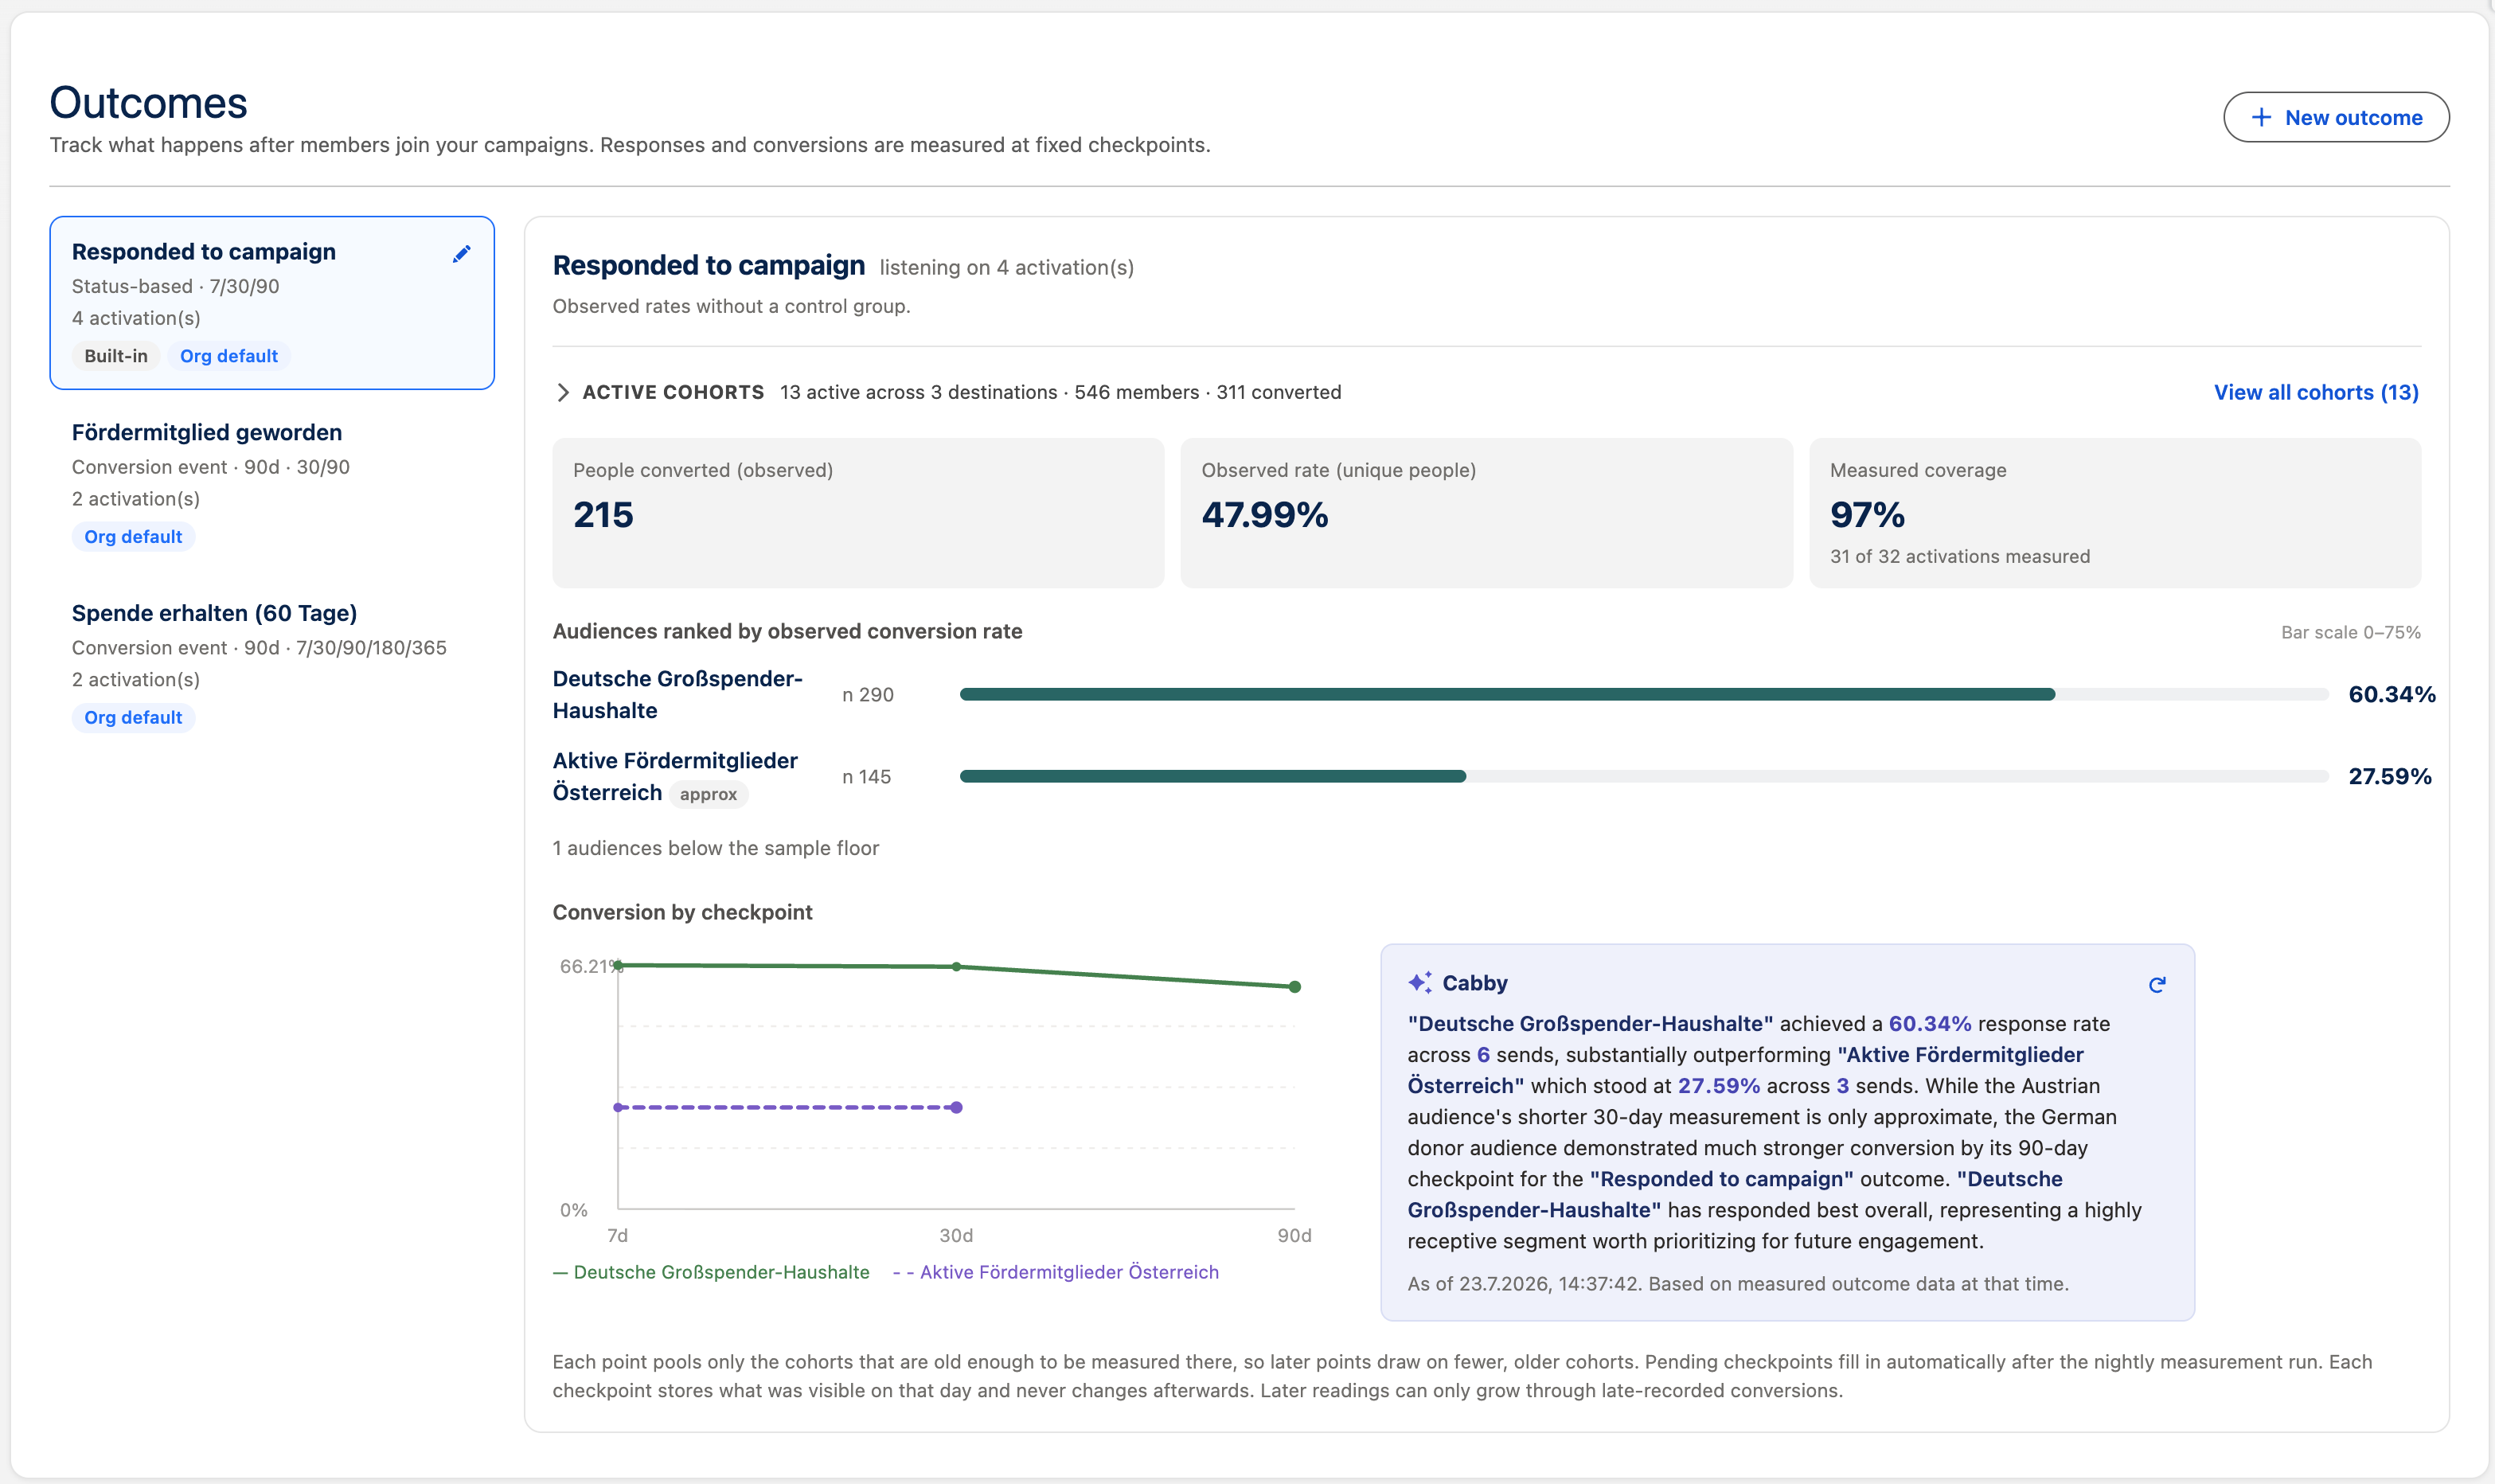
Section titled “Read the results”In CAB Outcomes, select a definition to see Audiences ranked by observed conversion rate and Conversion by checkpoint. In an audience, use the action-bar button Outcomes, or open a run’s Outcome measurement. The audience modal includes Open in the Outcomes tab.
Inspect active cohorts and converters
Section titled “Inspect active cohorts and converters”While a cohort is still measuring, its Active cohorts section is available from three places:
- Select the outcome in CAB Outcomes.
- Open an audience’s Outcomes view and select the outcome.
- Open the activation in Run History and find Outcome measurement.
Holdout members do not appear in Active cohorts. Inspect them separately with View / export control group.
Each row identifies the activation, audience, and destination, then shows its checkpoint state and, when available, its member and converter counts. Select View cohort to inspect the roster.
The viewer opens at the latest completed Checkpoint. Choose an earlier checkpoint when available. Use All, or Converted when that option is enabled. Use Select Fields to Display to add member fields. The table includes Member, Conversion status, First observed, Evidence, and Evidence date. For a converted member, Evidence links to one qualifying Salesforce record when it is accessible.
Before the first measurement, the cohort remains available with Awaiting first checkpoint; counts are withheld and Converted is disabled. The roster is removed after the final checkpoint closes the cohort. If that happens while the viewer is open, CAB shows This cohort is no longer available.
The viewer follows your Salesforce access. If a captured member or evidence record was deleted or is no longer accessible, CAB shows Member record unavailable or Evidence record unavailable instead of exposing the record.
How the clock works
Section titled “How the clock works”- Day zero starts when that cohort is activated—not when the outcome or schedule was created.
- The conversion window decides which dated conversions count.
- Checkpoints decide when CAB looks and stores a reading.
- You can choose up to six checkpoint days, all within 730 days. The last checkpoint must cover the conversion window.
- Creating an outcome later does not backfill earlier activations.
- Editing a rule creates a new version; existing cohorts finish under the version they started with.
Interpret checkpoint curves
Section titled “Interpret checkpoint curves”Each activation’s checkpoint is a frozen reading: it stores what CAB could see on that day and is not rewritten later. A conversion dated inside the window but entered after an earlier checkpoint can first appear in a later reading. This is why a later checkpoint can grow even though the earlier stored reading stays unchanged.
Organization and audience performance curves pool eligible activations at each checkpoint. Hover a point to see a value in the form …% (n=…, pooled from … activation(s)). A later point can change as additional activations become old enough to contribute, and it normally uses fewer, older cohorts than an early point. Compare the point’s sample size and activation count instead of treating every point as the same population.