

Understand an audience with composition profiles
Know who is inside
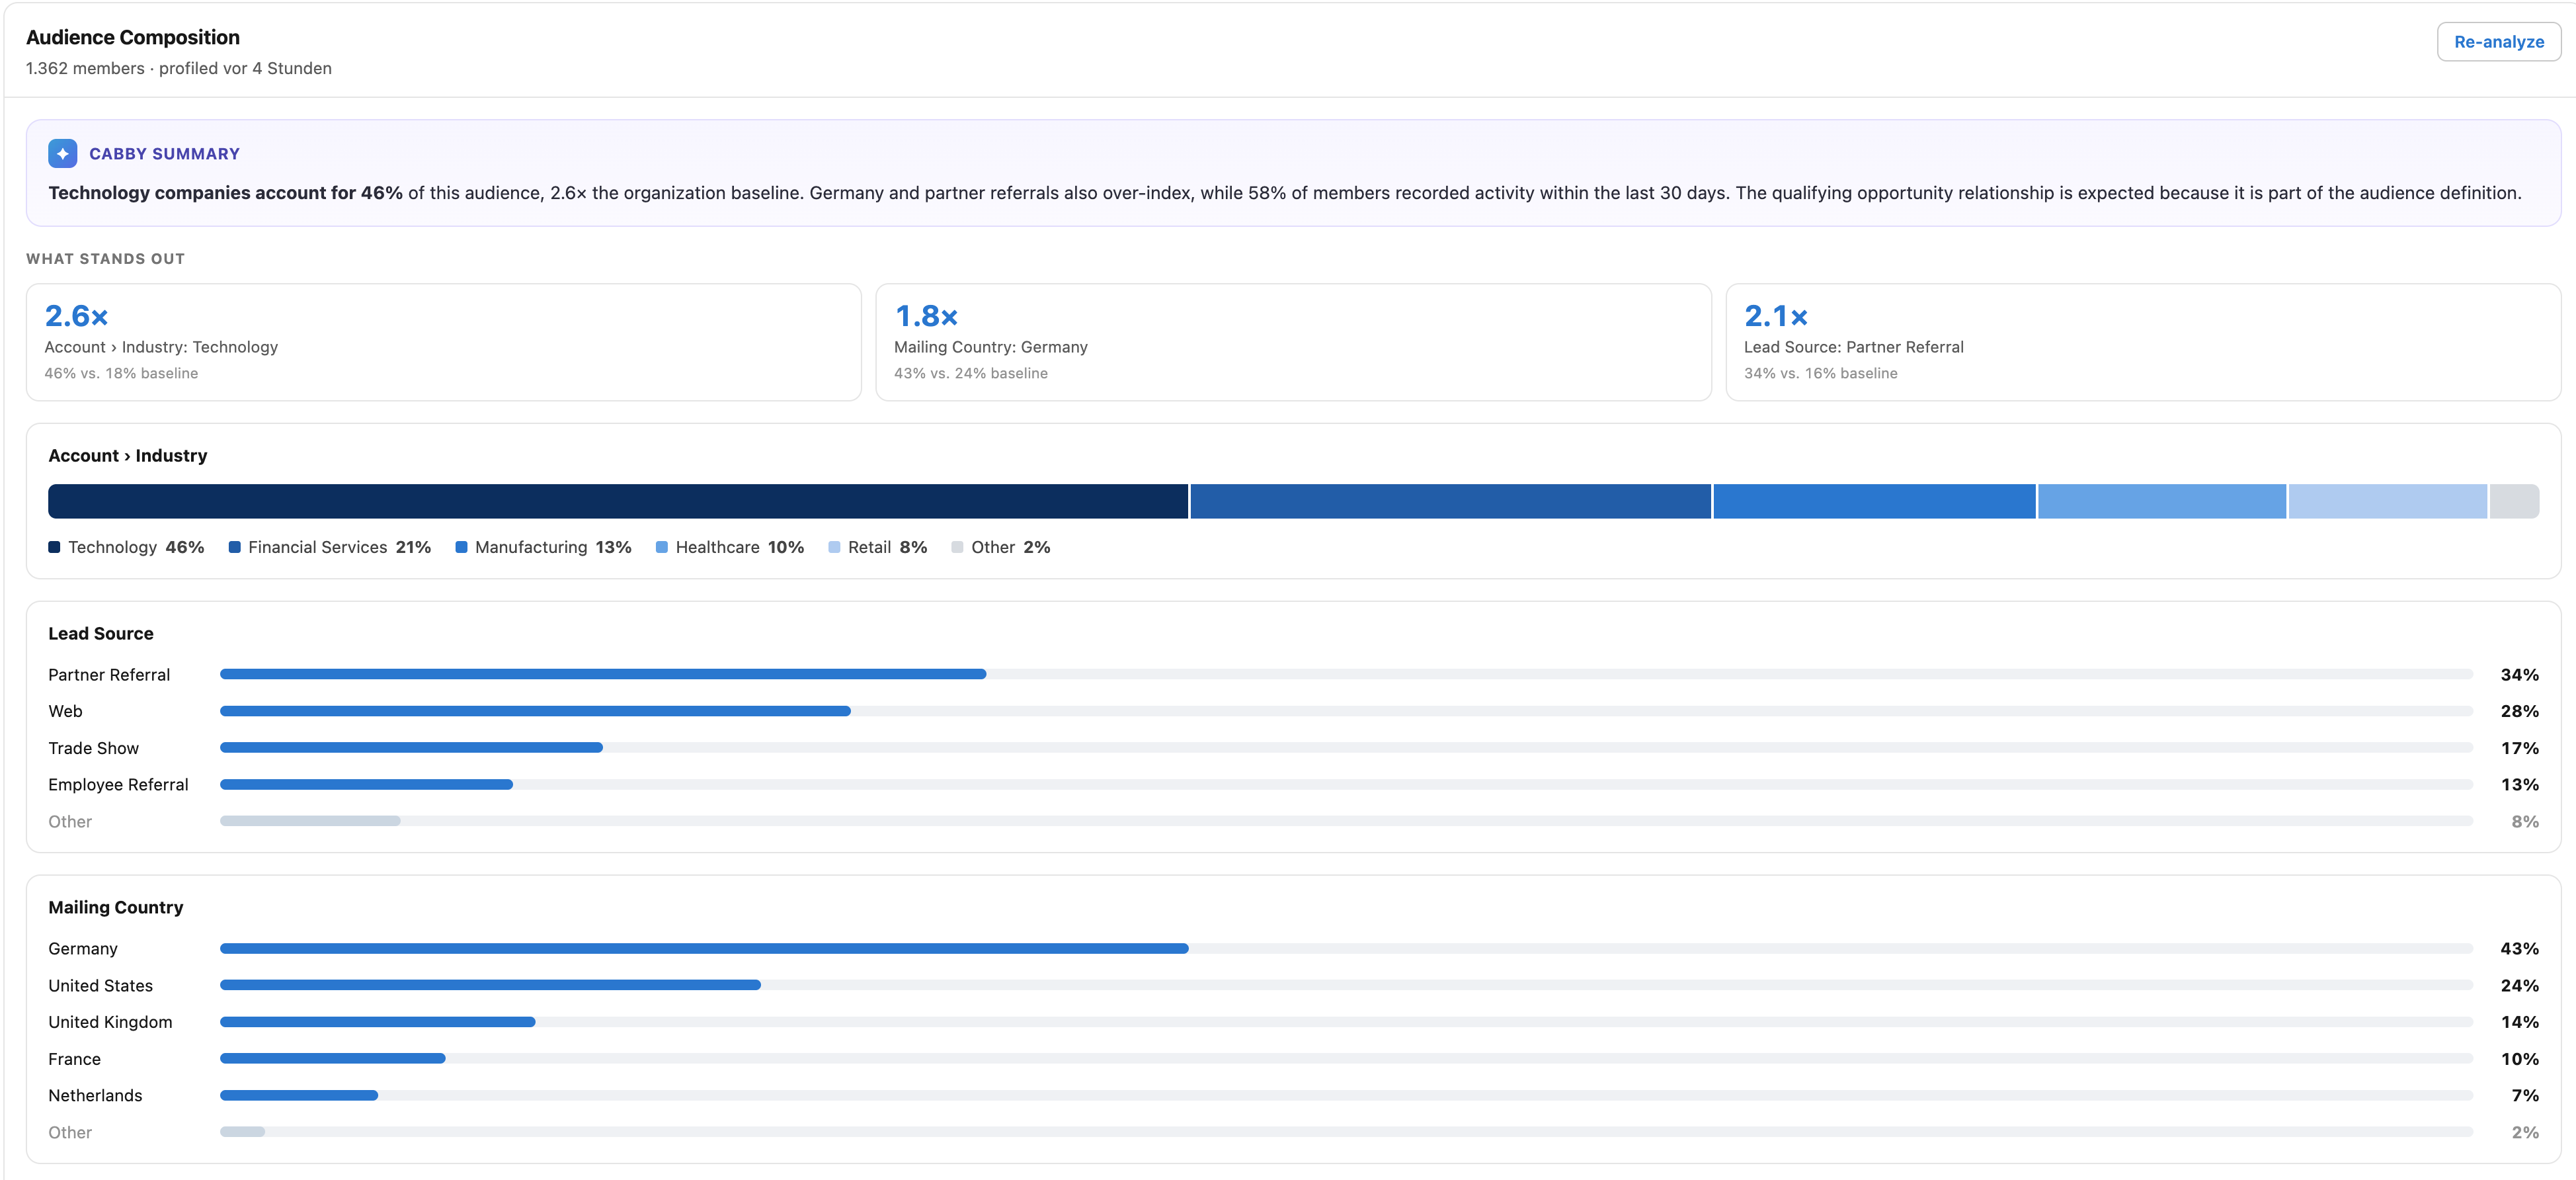
A result count tells you how many people matched. Audience Composition explains what the group looks like: prominent values, recency bands, missing data, differences from the organization baseline, and a short Cabby narrative.
Sampled at scale · Cabby summary · Automatic mode
Analyze a run
Section titled “Analyze a run”- Open an audience’s Run History and select a completed run.
- In Audience Composition, select Analyze. Use Re-analyze if you want to recompute it later.
- Start with Highlights, then review What stands out, As filtered, and the Cabby Summary.
Highlights focus on meaningful divergence from the wider organization and on data-quality signals. Fields used directly in the audience filters are separated as As filtered, so an expected skew is not presented as a surprising discovery.
Exact versus sampled
Section titled “Exact versus sampled”Smaller audiences can be profiled in full. Larger audiences use a representative sample and show Profile based on … members (sampled). Sampling keeps the job bounded while remaining useful for distribution-level insight.